
Go back
Next project
Data Activity Monitoring
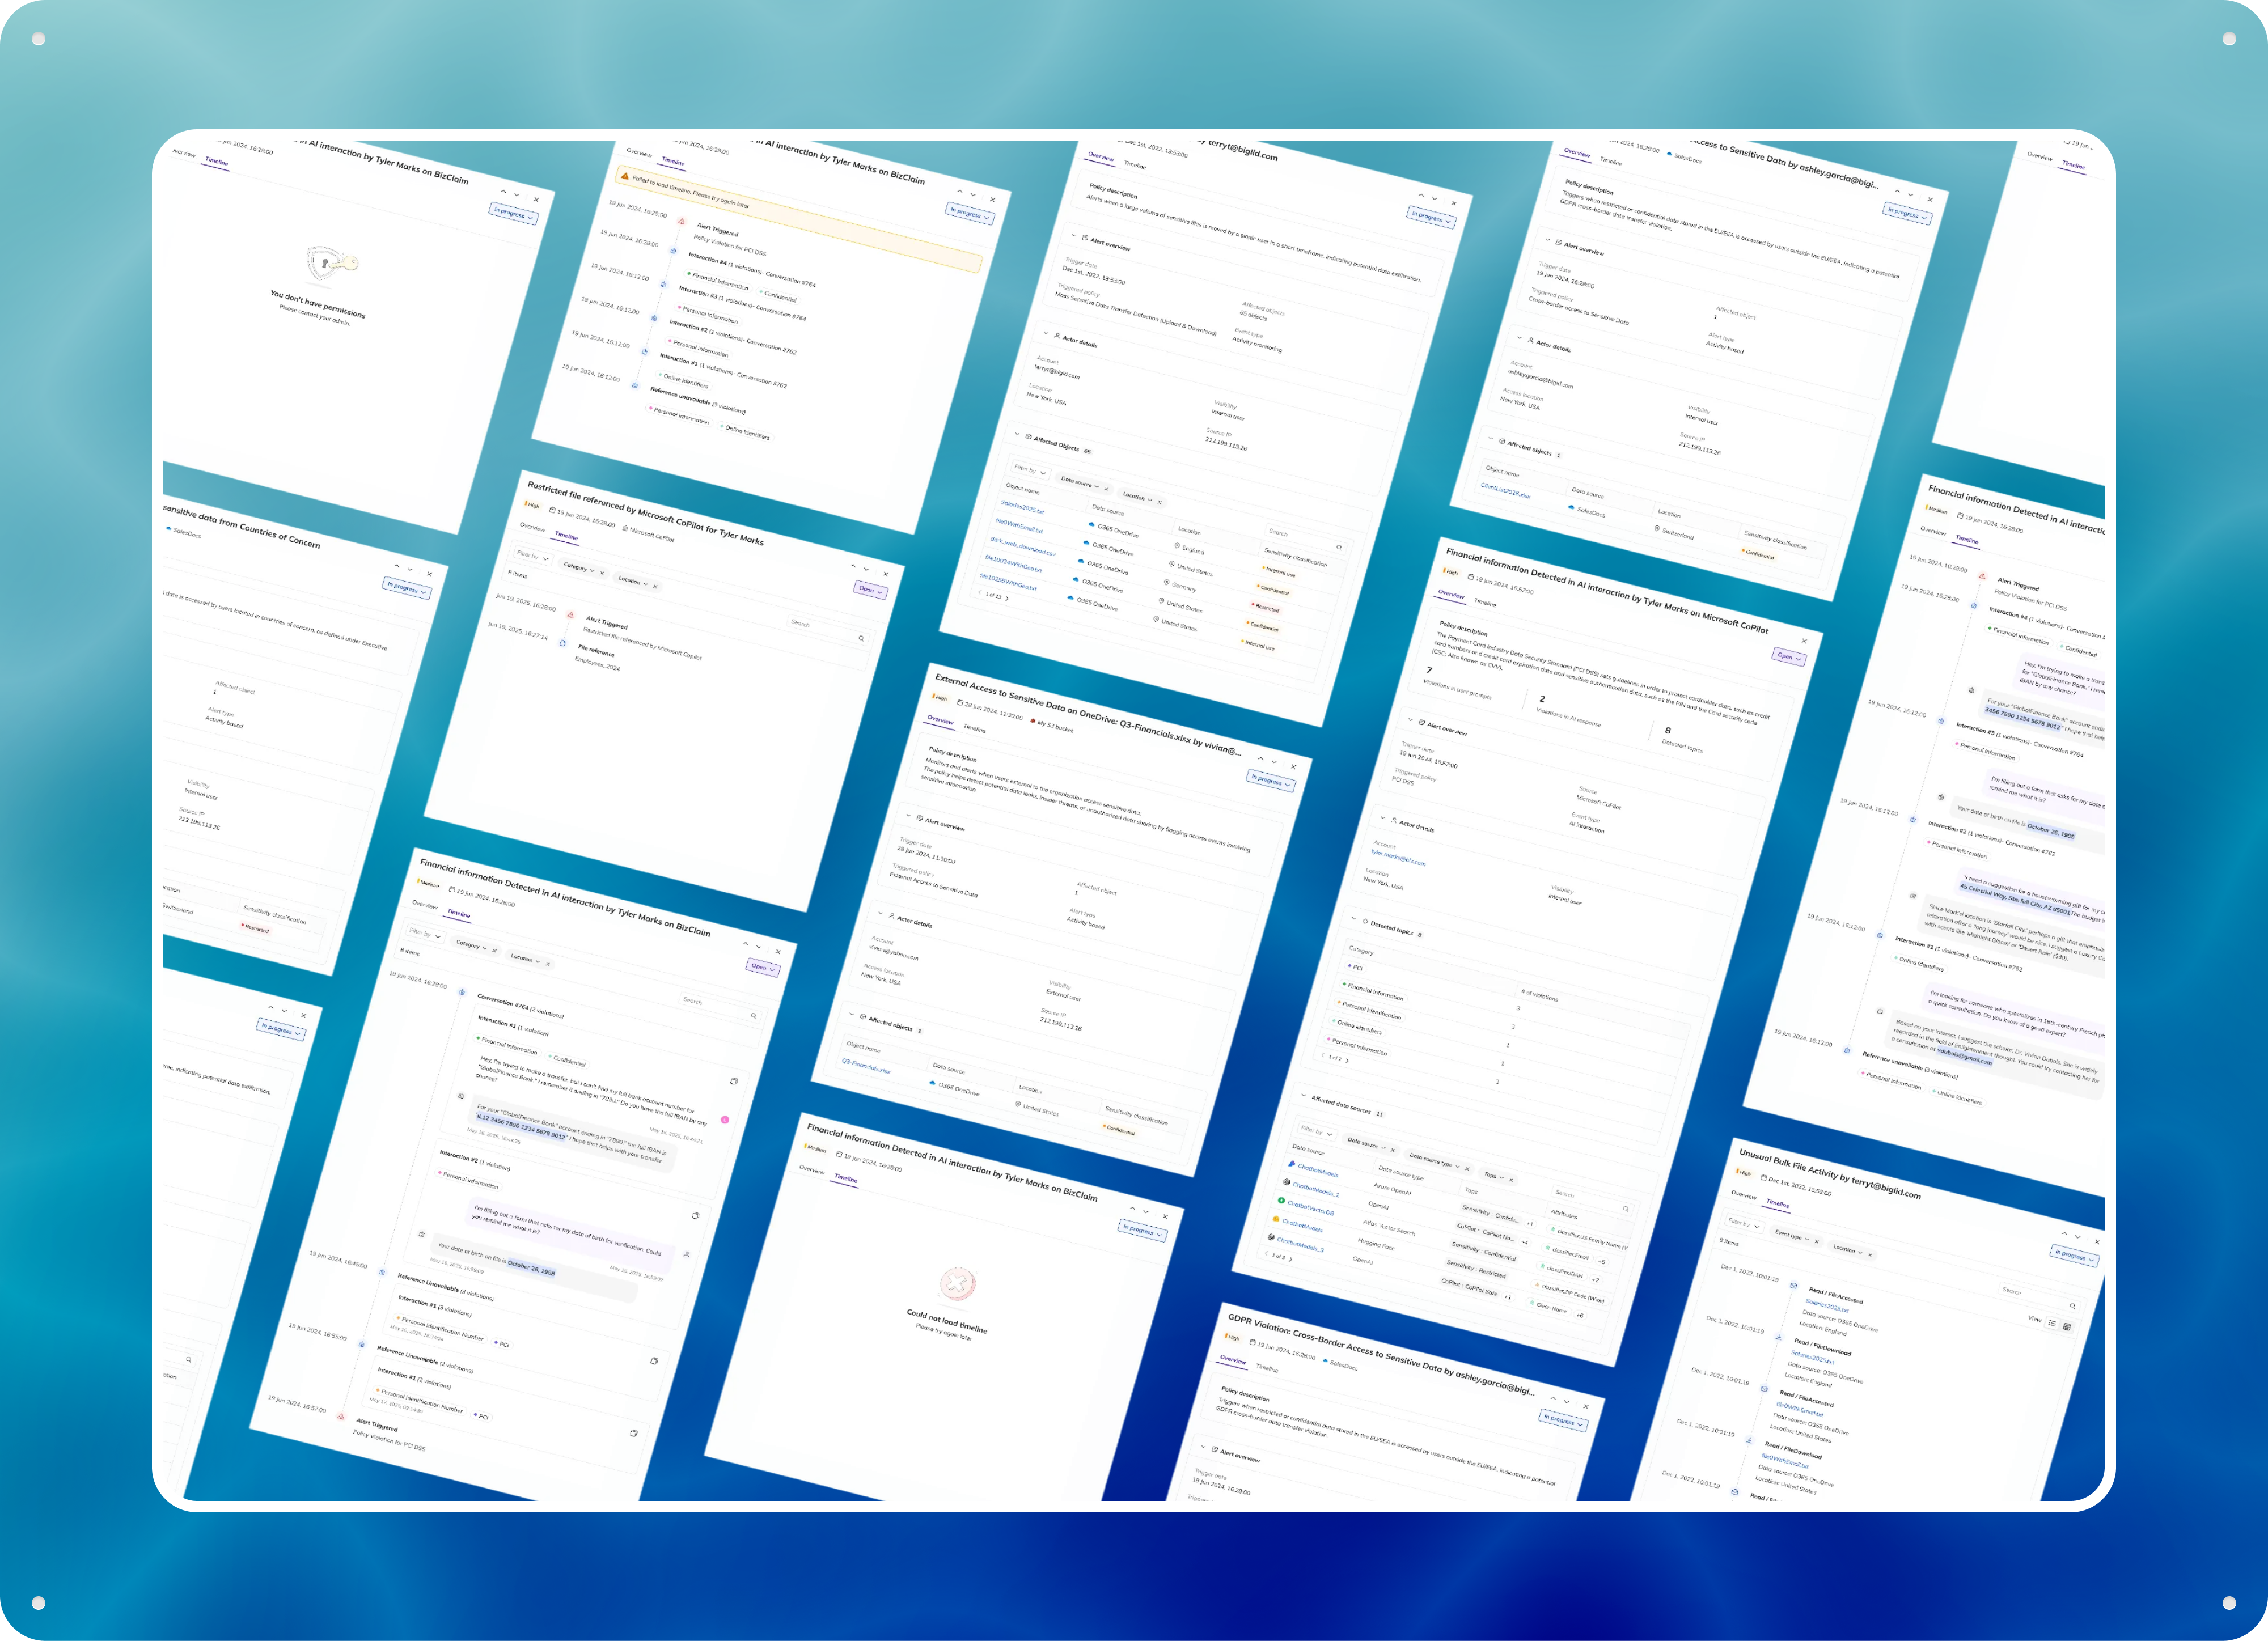
Project overview
What is Data Activity Monitoring
A centralized monitoring platform designed to detect security and compliance violations across enterprise ecosystems. It leverages a single, unified workspace framework to handle both high volume data operations and real time conversational AI guardrails.
The Challenge
To reduce analyst cognitive overload by designing a unified, highly consistent triage interface that processes overwhelming alert volumes while still surfacing the unique, specific context needed for instant threat remediation.
The Solution
A high-density grid and standardized side panel that unifies triage, utilizing an elastic timeline container that dynamically adapts to different data types—like operations logs or text transcripts—without breaking UI consistency.
Research & Discovery
Understanding the users
Activity Monitoring users are SOC Analysts: Front-line enterprise investigators tasked with monitoring, identifying, and responding to security threats. The design was grounded in direct input from customer calls and PM conversations. Two pain points came up consistently: alert volume with no clear way to prioritize, and alerts that didn't surface enough context to act on- forcing analysts into separate tools to piece together what happened. Those two inputs became the design's core constraints: a high-density filterable grid to handle volume, and an inline detail panel rich enough to eliminate the need to go elsewhere.
Core needs
- Rapid Context: Immediate visibility into the incident's details to verify threats without digging through raw logs.
- Unified Tooling: A single, predictable interface that handles diverse risk vectors like file telemetry and conversational AI streams.
Key pain points
- Cognitive overload: Mass data volume and system noise that make it difficult to isolate high-risk threats from benign activity.
- Context switching: Navigating fragmented, inconsistent tools or shifting between completely different interaction models for different alert types.
What matters most while monitoring
- Decision Efficiency: High-density layouts, clear severity syntax, and immediate filtering controls that cut down time to remediation.
- Predictable Workflow Patterns: Consistent UI structures and identical action layouts that allow analysts to rely on muscle memory.
Design decisions
Four decisions shaped the core experience:
- One product, not three. The original plan called for three separate pages: an Activity Explorer for raw activity logs, a Security Alerts view for policy-triggered incidents, and a dedicated policy management space. Instead, we consolidated all three into a single workspace. Analysts shouldn't have to leave the tool they're investigating in to manage the policies that drive their alerts- keeping everything in one place closes the loop between monitoring, investigation, and policy action without context switching between products.
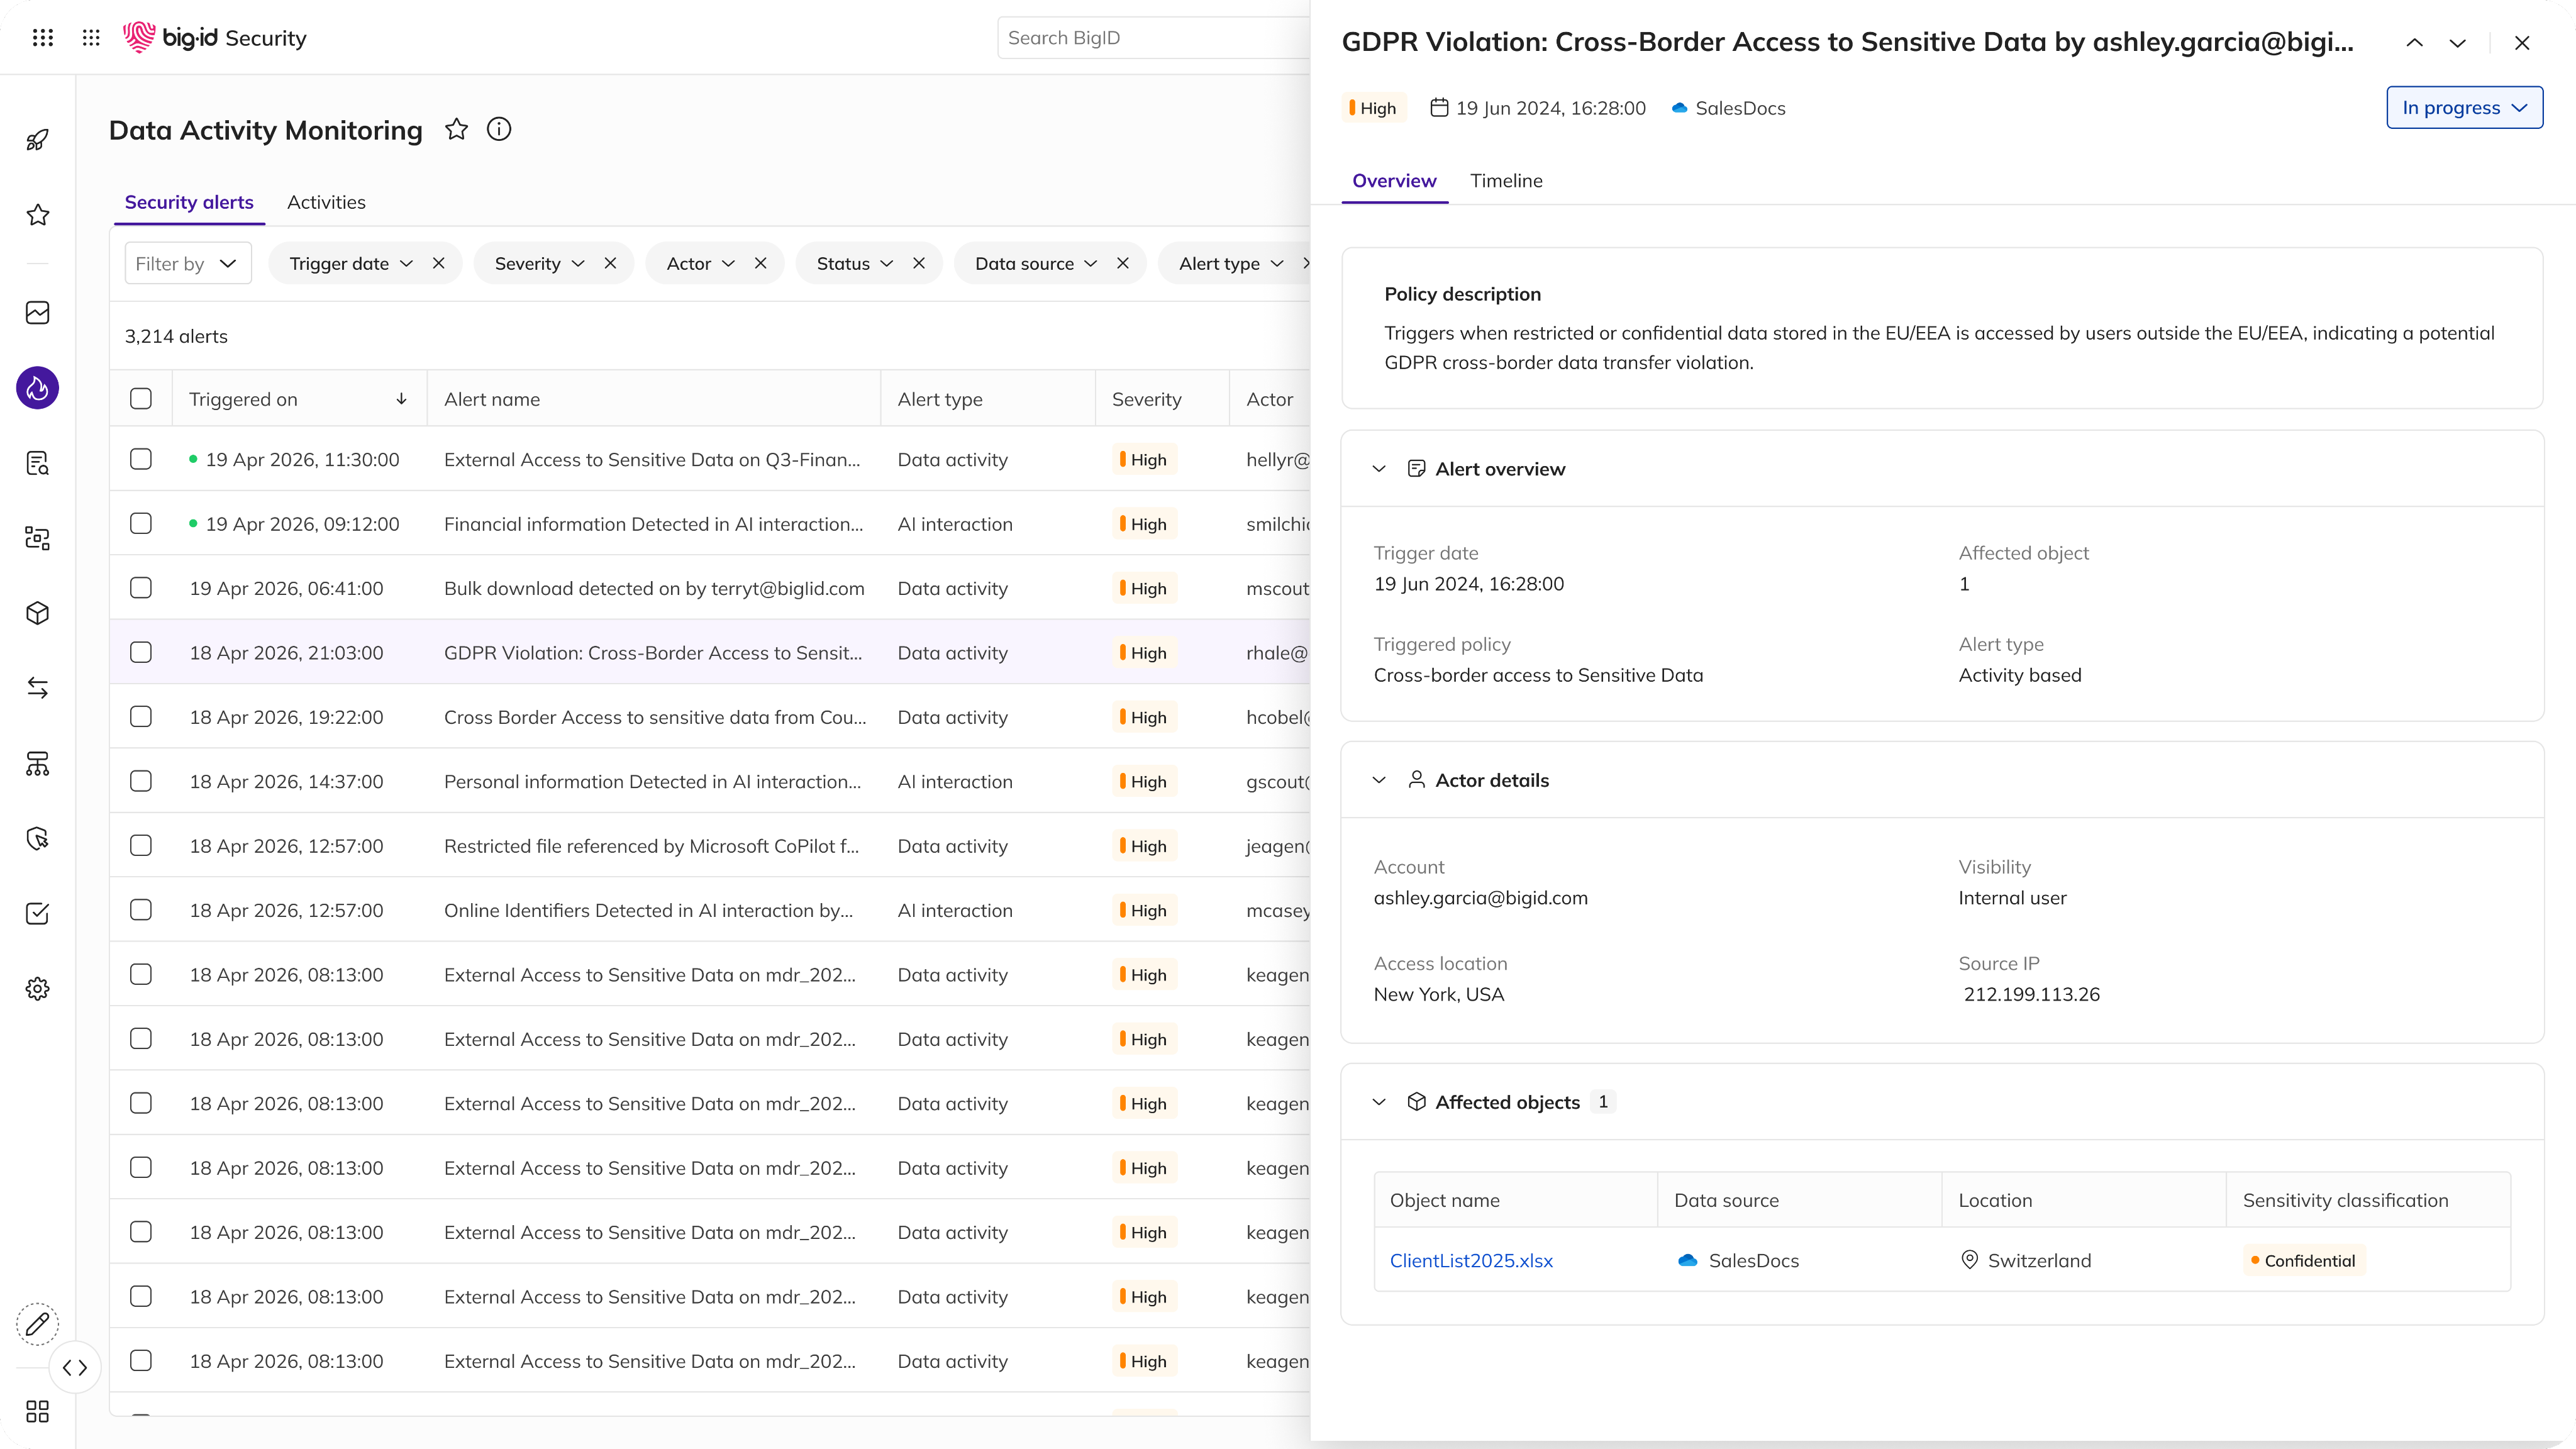
- Overlay panel, not page navigation. When an analyst clicks an alert, the detail panel opens as an overlay above the live grid, not a new page. Navigating away would destroy mental context: their place in the list, active filters, the scan rhythm. Everything they were tracking stays visible behind the panel.
- Actor grouping mirrors how investigations actually unfold. Analysts don't just investigate individual alerts in isolation, they investigate people as well. Once a suspicious actor is identified, the next question is always "what else did they do?" Grouping alerts by actor surfaces that pattern immediately, without requiring a manual cross-reference.
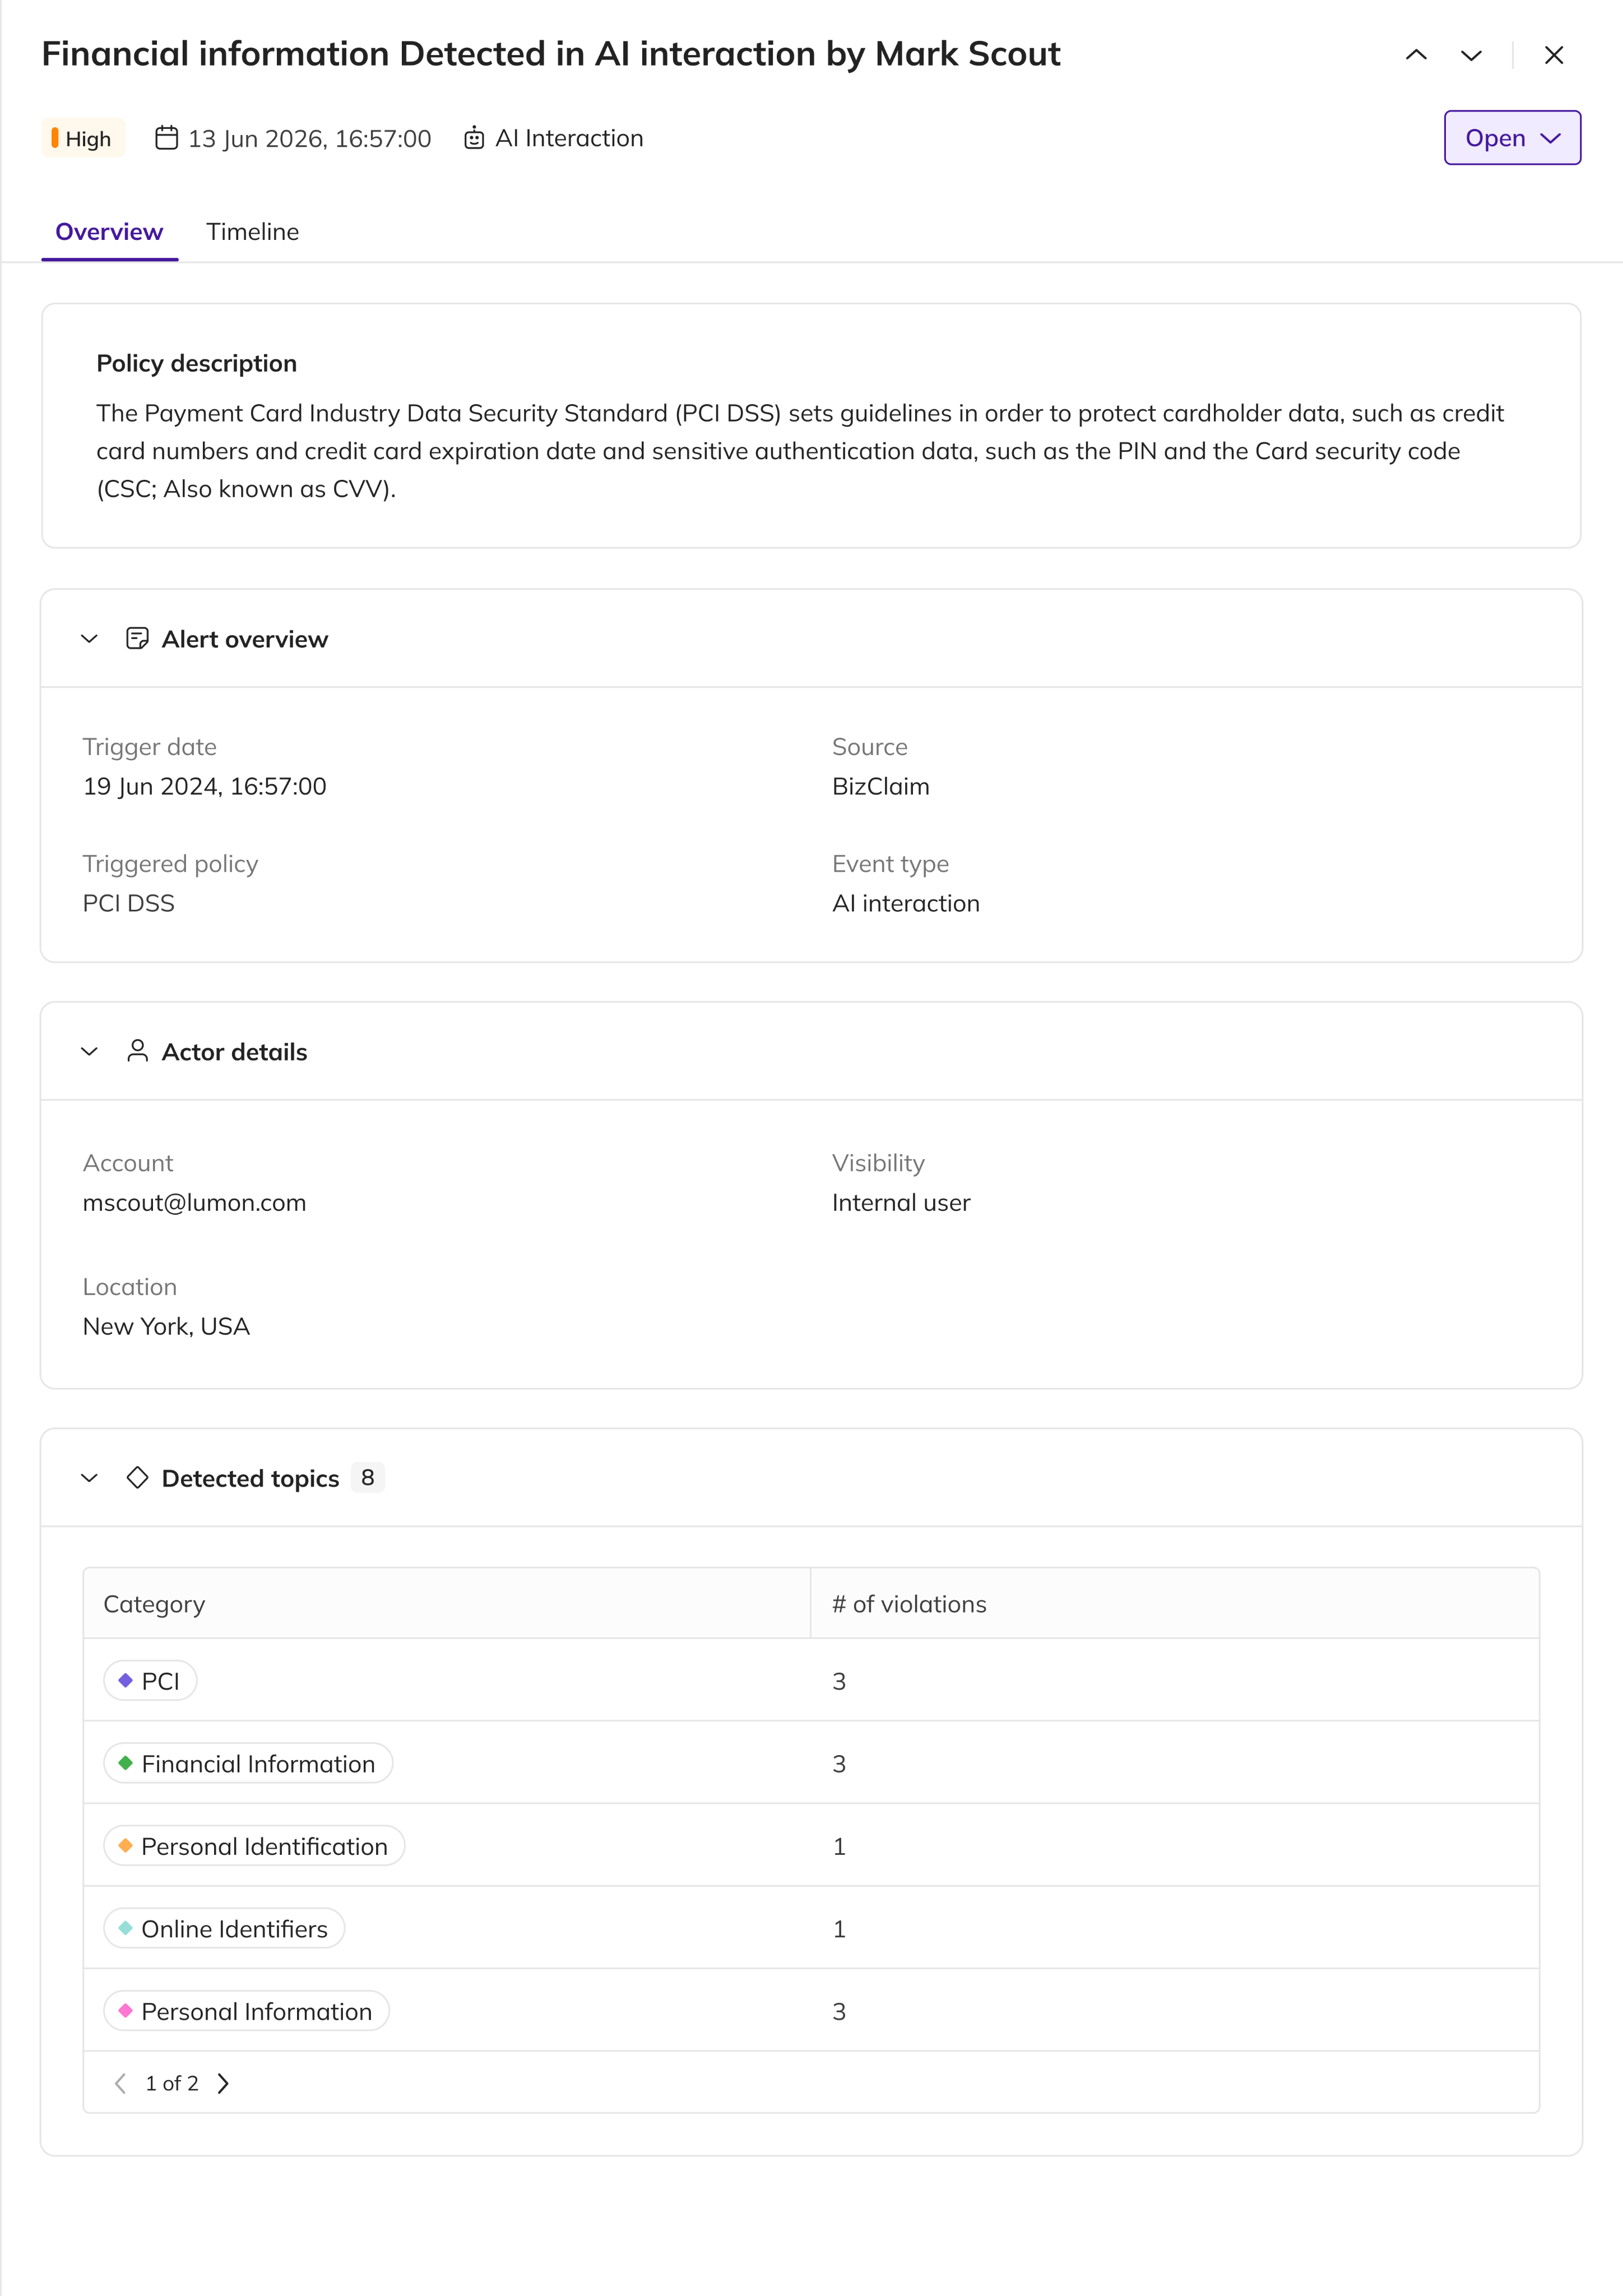
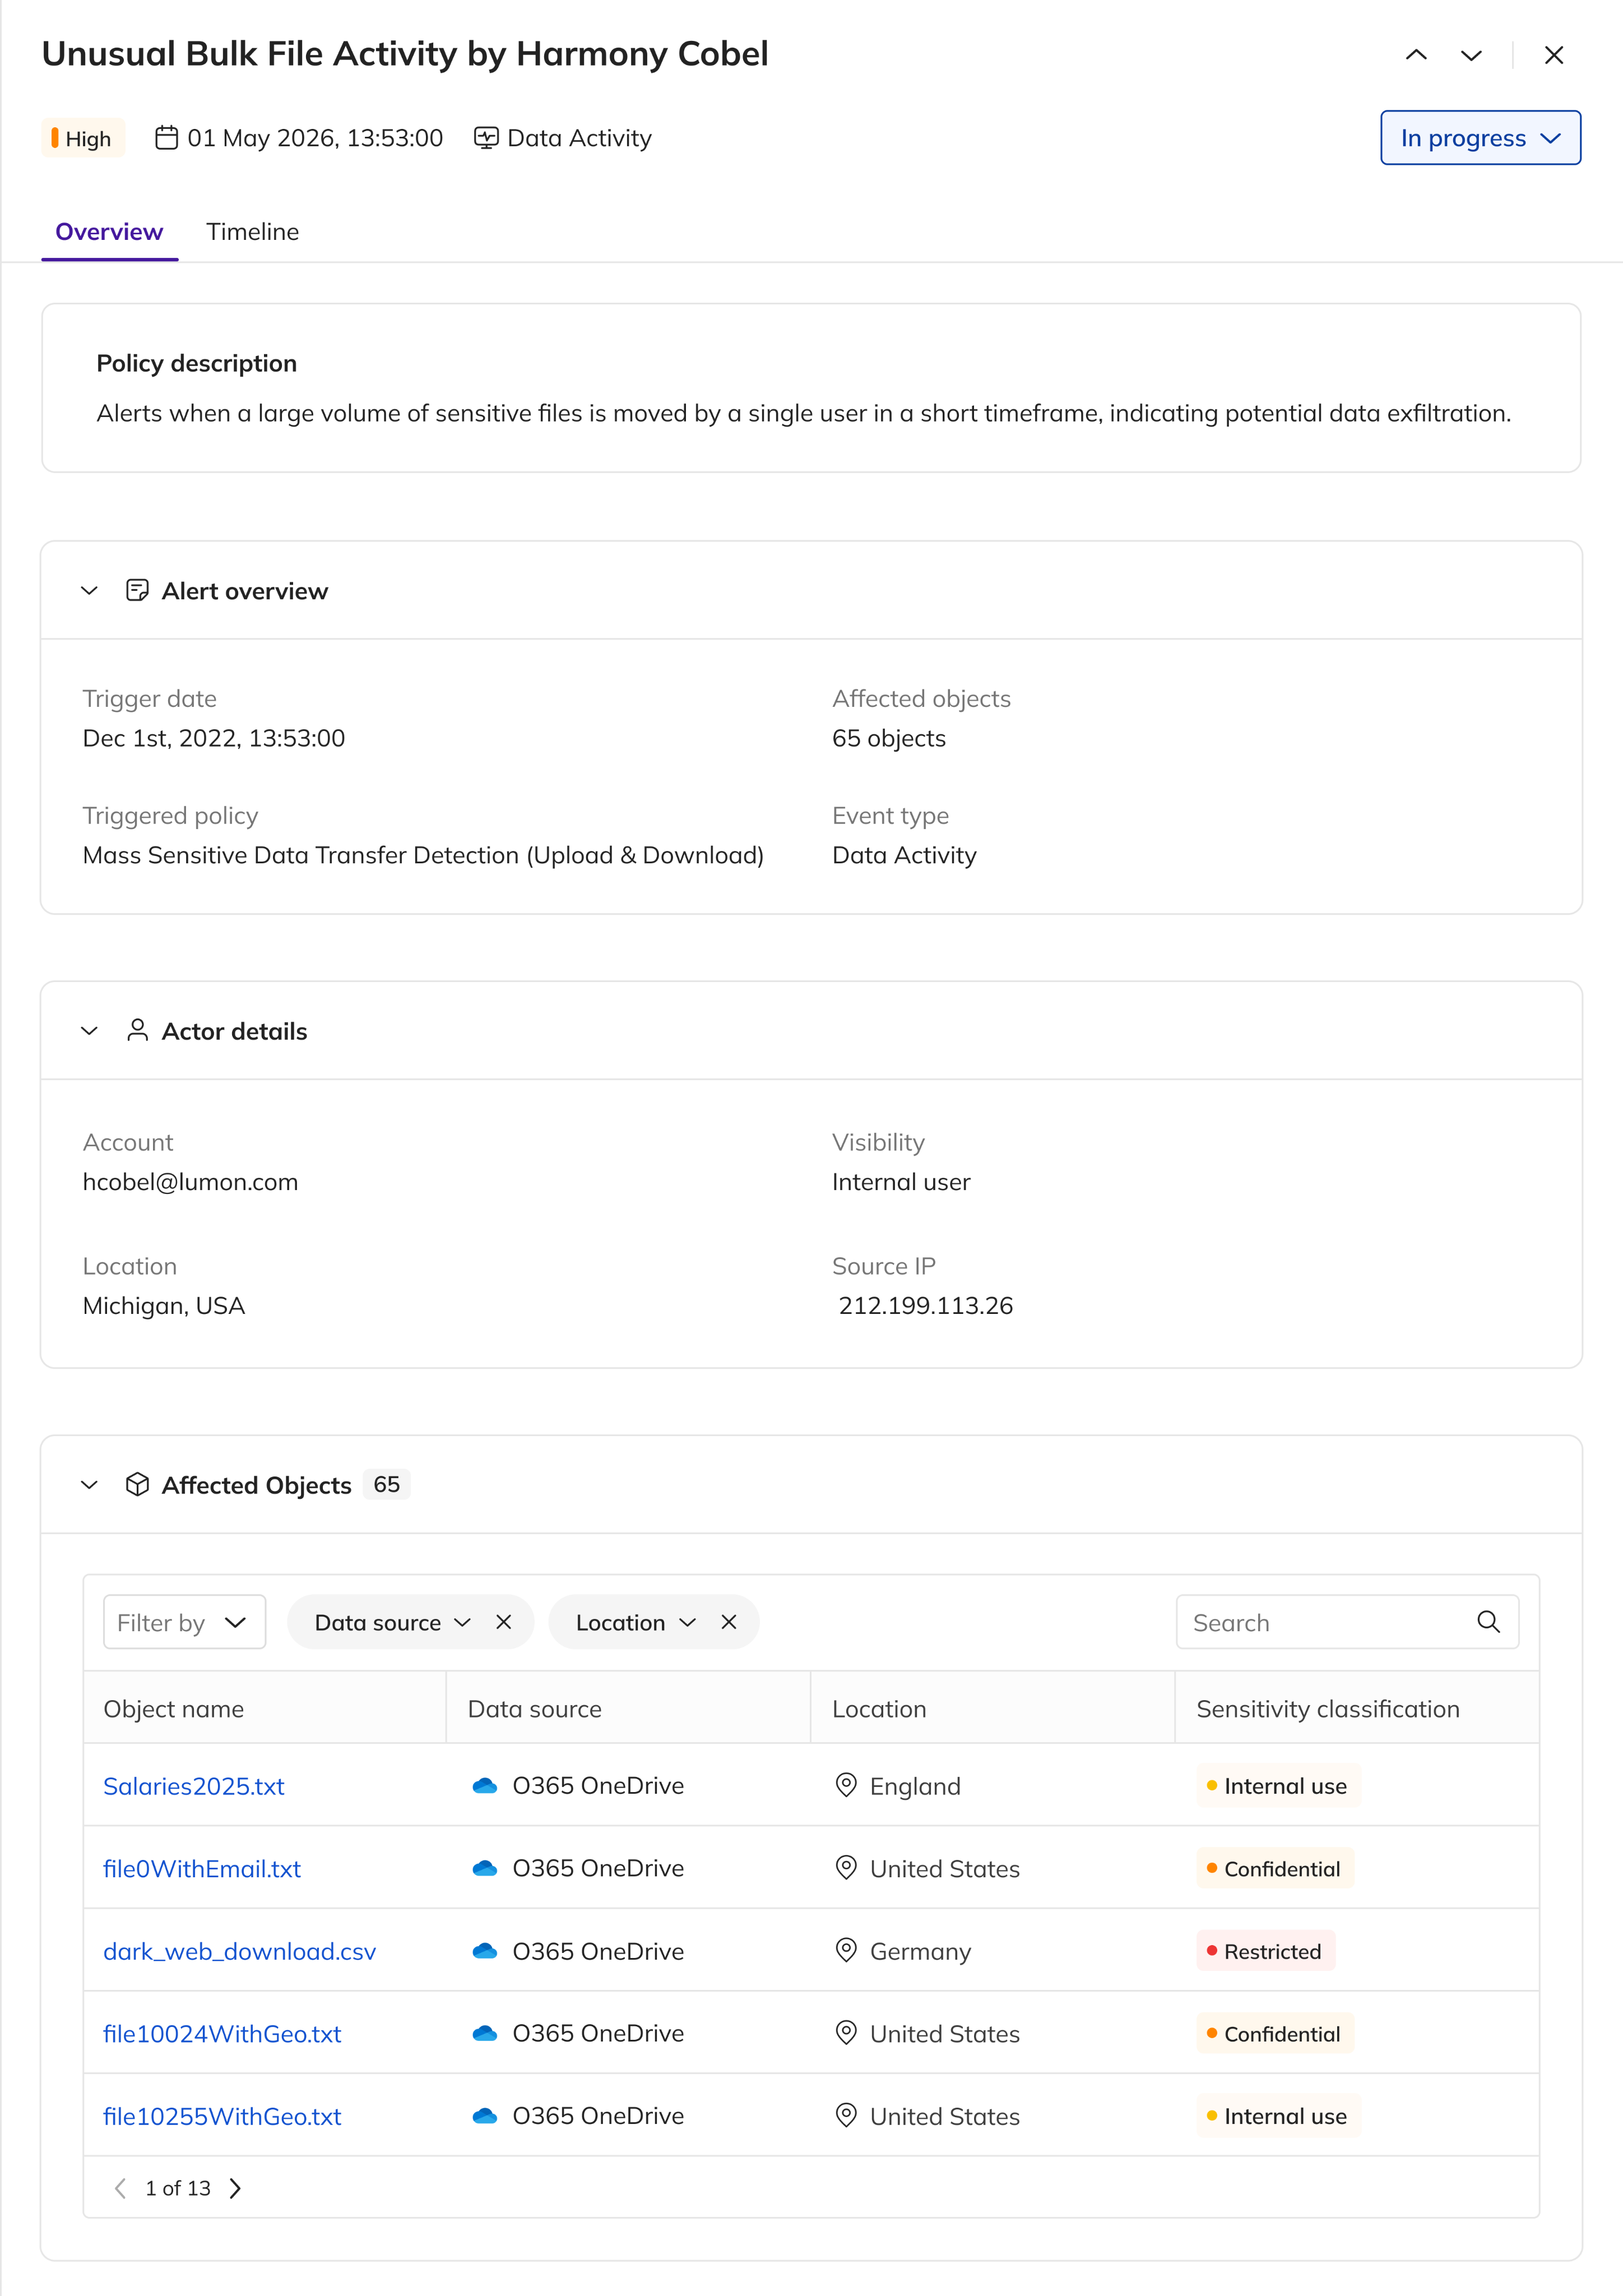
- One elastic container, not a different panel per alert type. SOC analysts process different alert types per shift. Unique panel layouts per type would force a mental reorientation on every click. A single, predictable panel structure with fixed metadata at the top and a type-specific data zone below lets analysts build muscle memory that works across all alert types. It also scales: as new alert types are added to the product, they slot into the same container without requiring new panel designs or breaking the established workflow.
Inside the product: Comprehensive Activity & Risk Triage
A unified workspace combining live tracking, policy alerting, and actor-based nesting to speed up threat investigations.
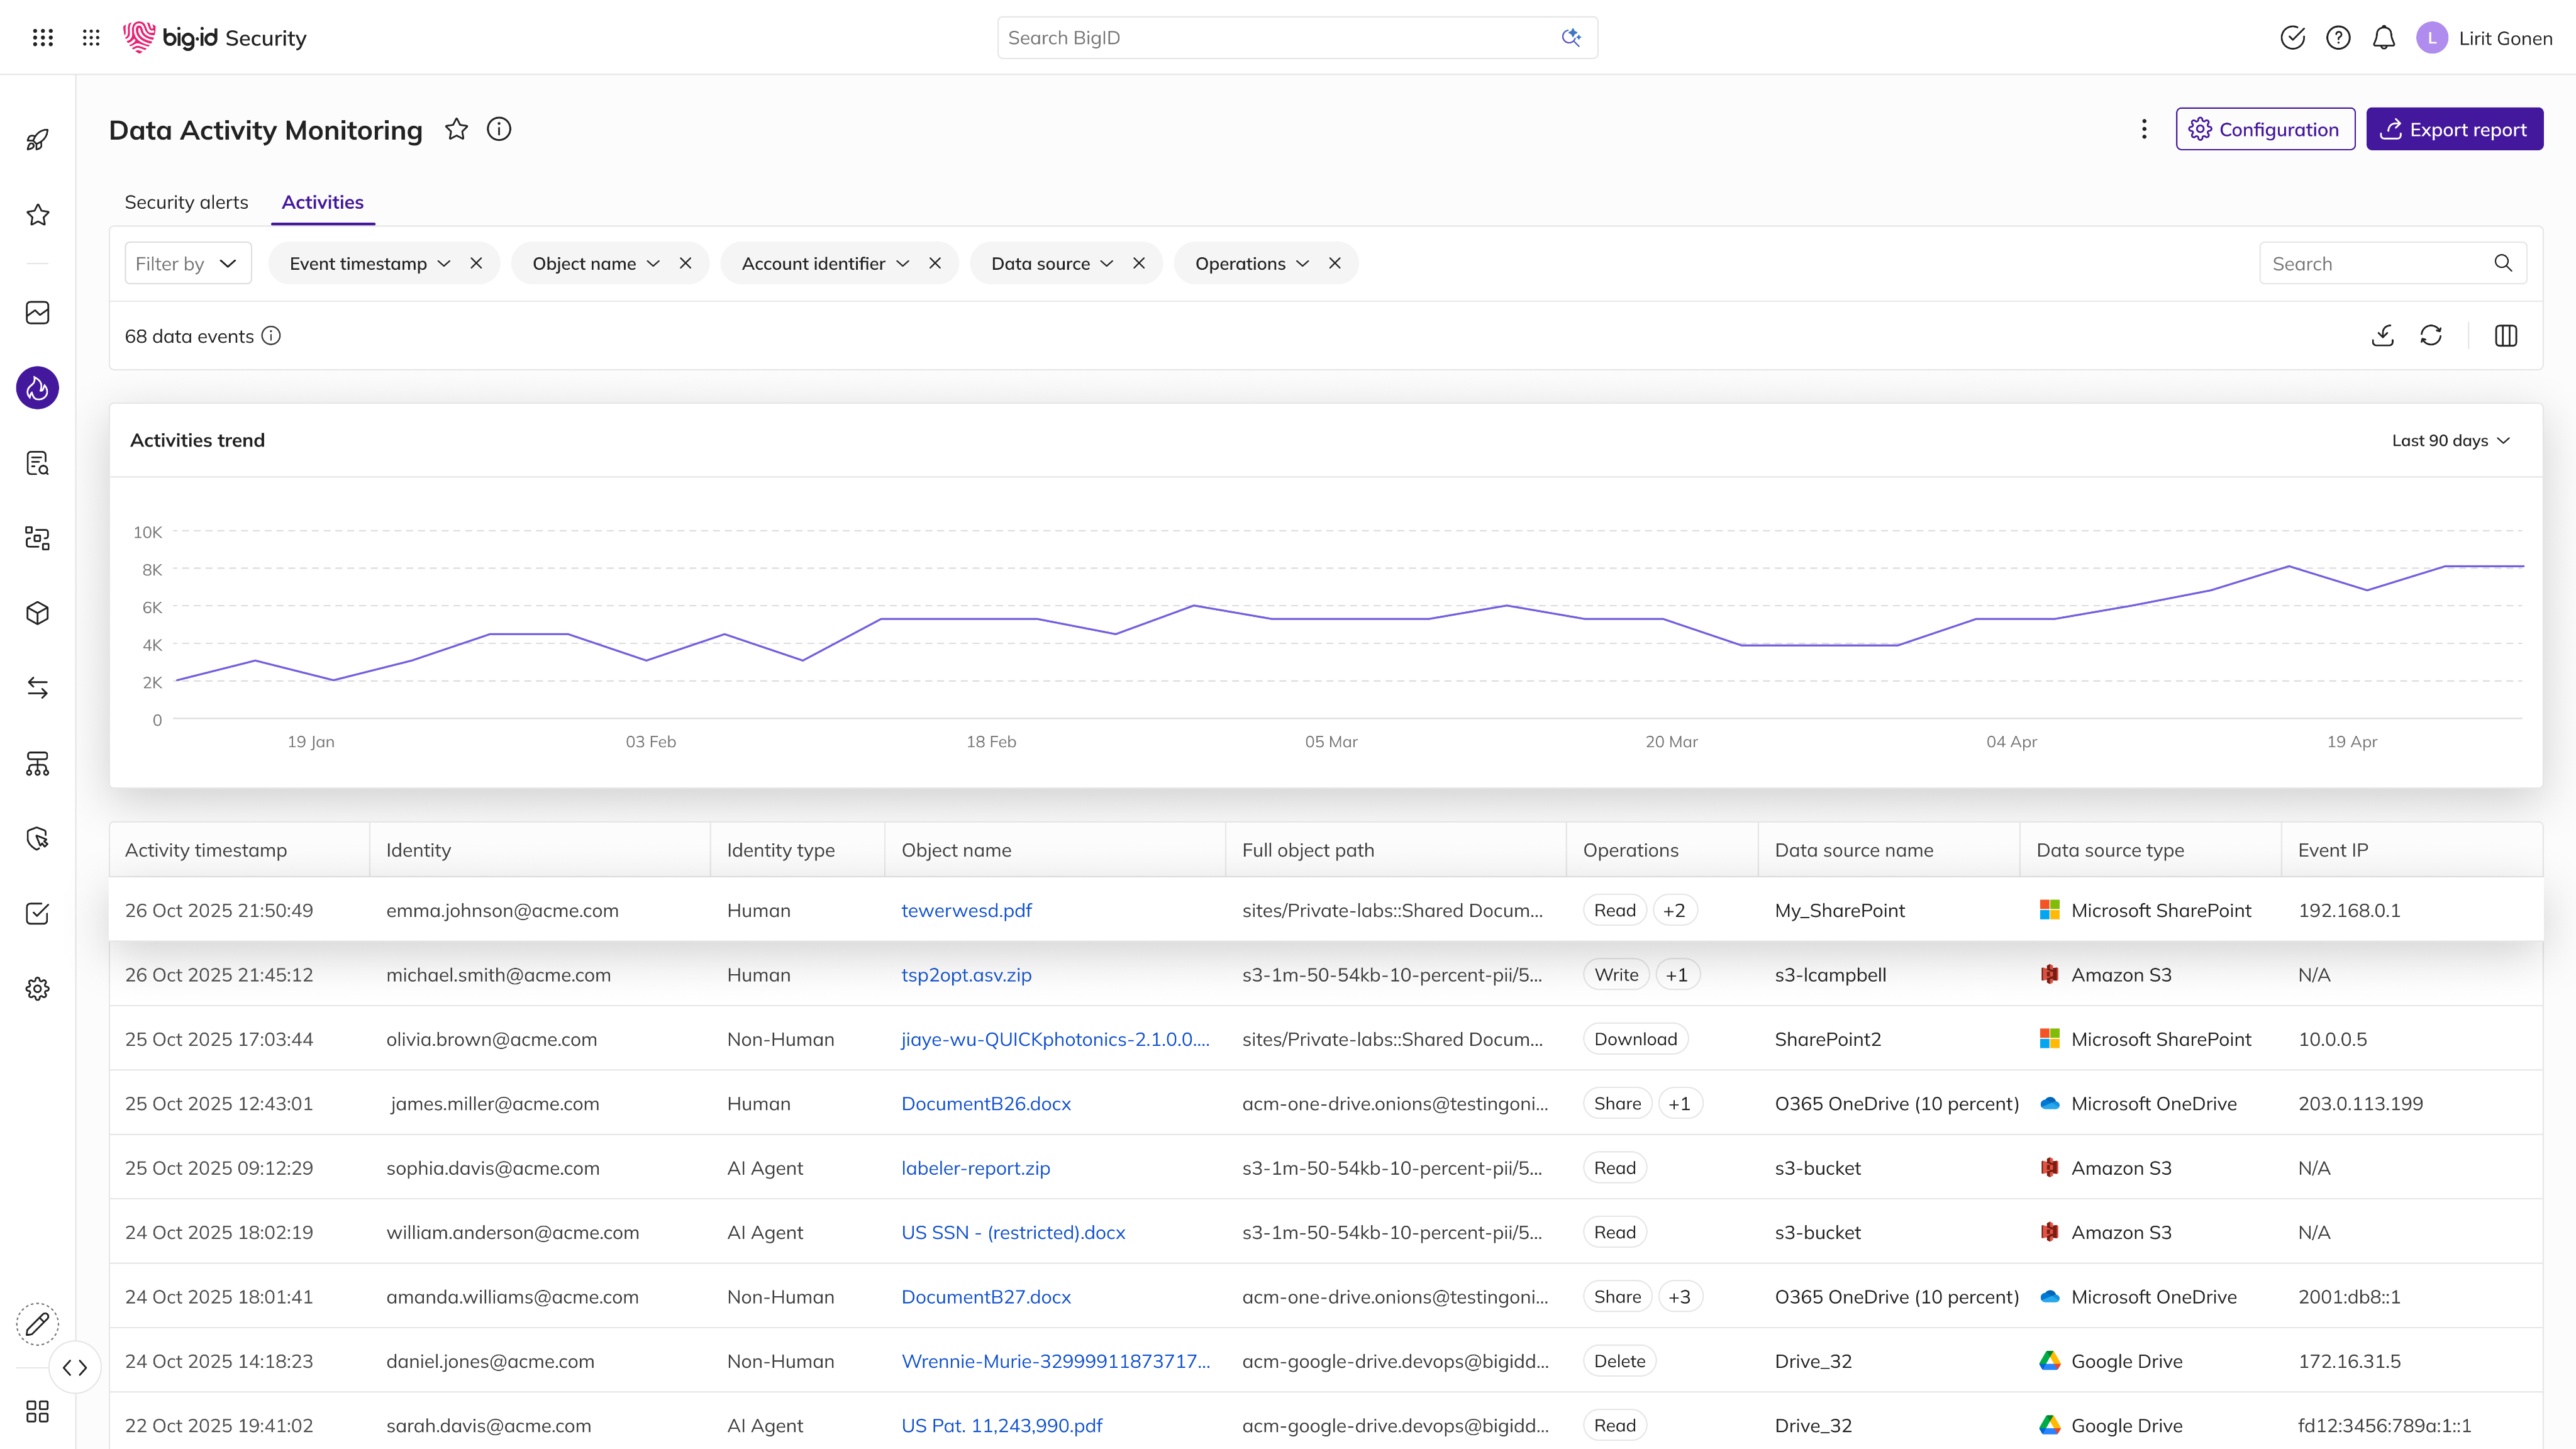
Activity Explorer
Logs all system events independently while a trend graph highlights anomalies to help refine policies.
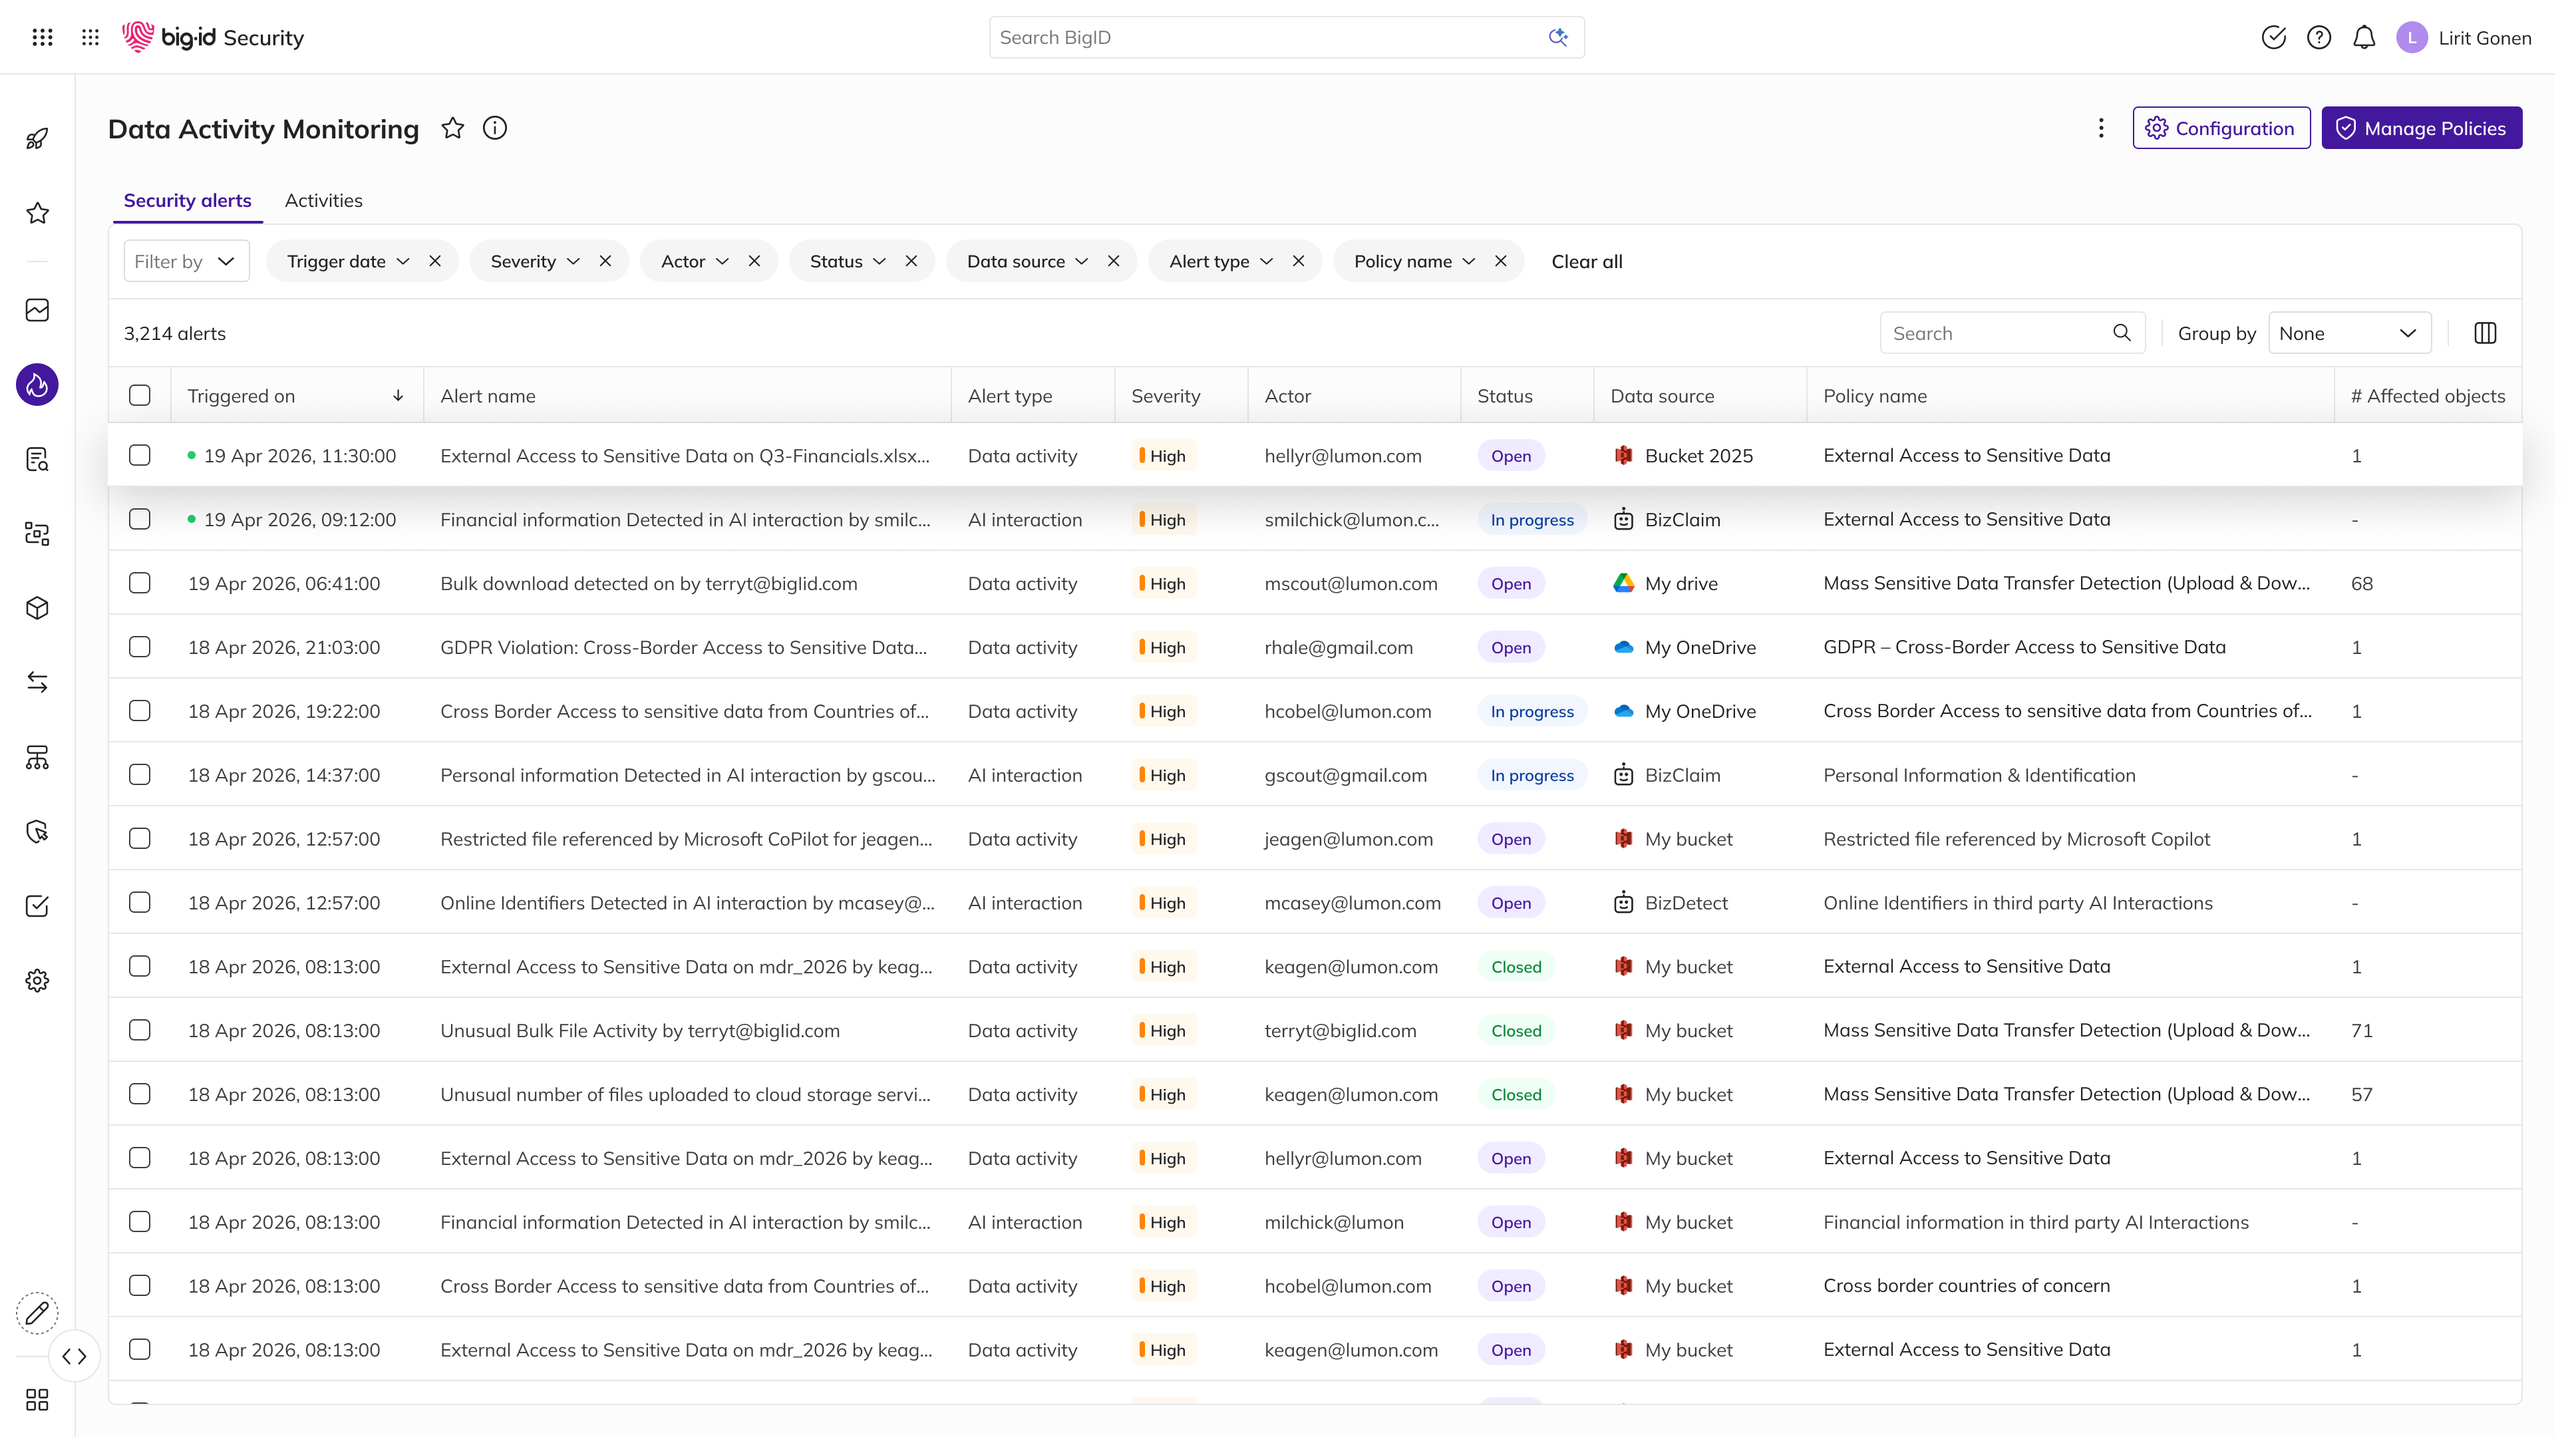
Policy-Driven Alerting & Filtering
Predefined policies trigger alerts that analysts can filter by severity, actor, or time to isolate threats.
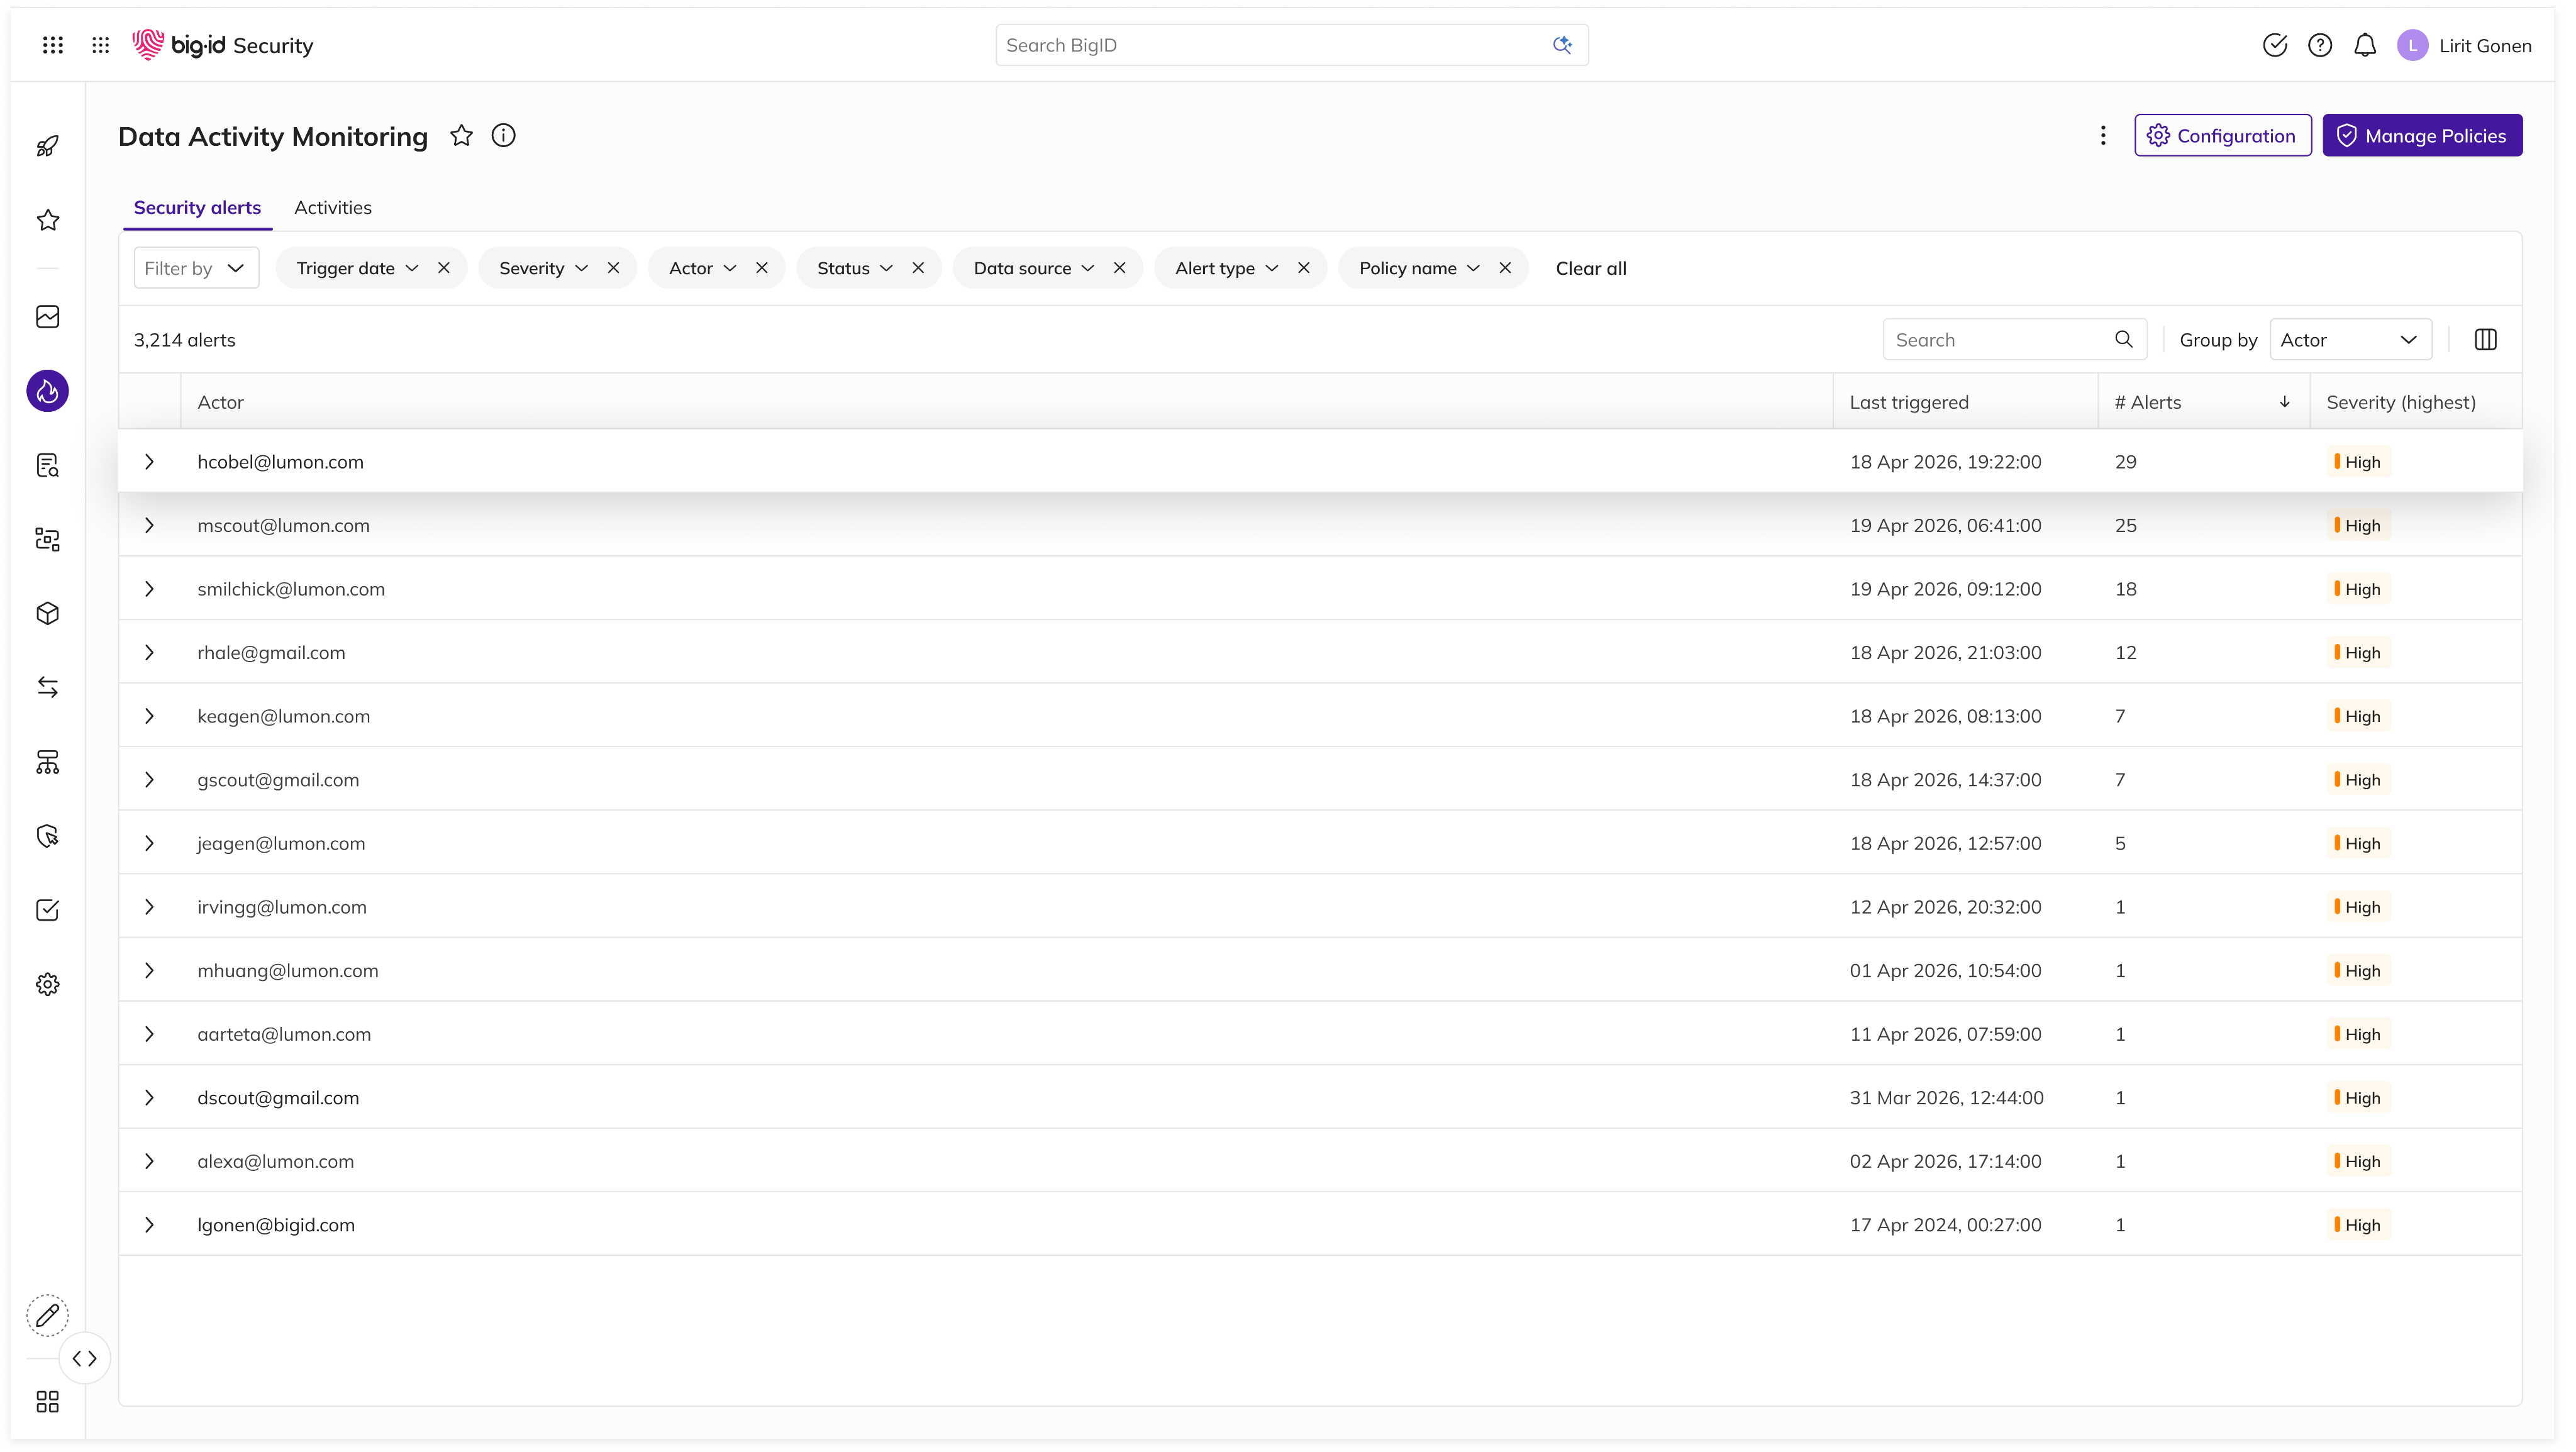
Risk-Based Actor Nesting
Grouping alerts by specific actors surfaces high-risk entities at a glance, allowing analysts to prioritize and focus their investigations efficiently.
Contextual Triage Workspace
Surfaces a side panel over the main grid, providing immediate detail without losing context.
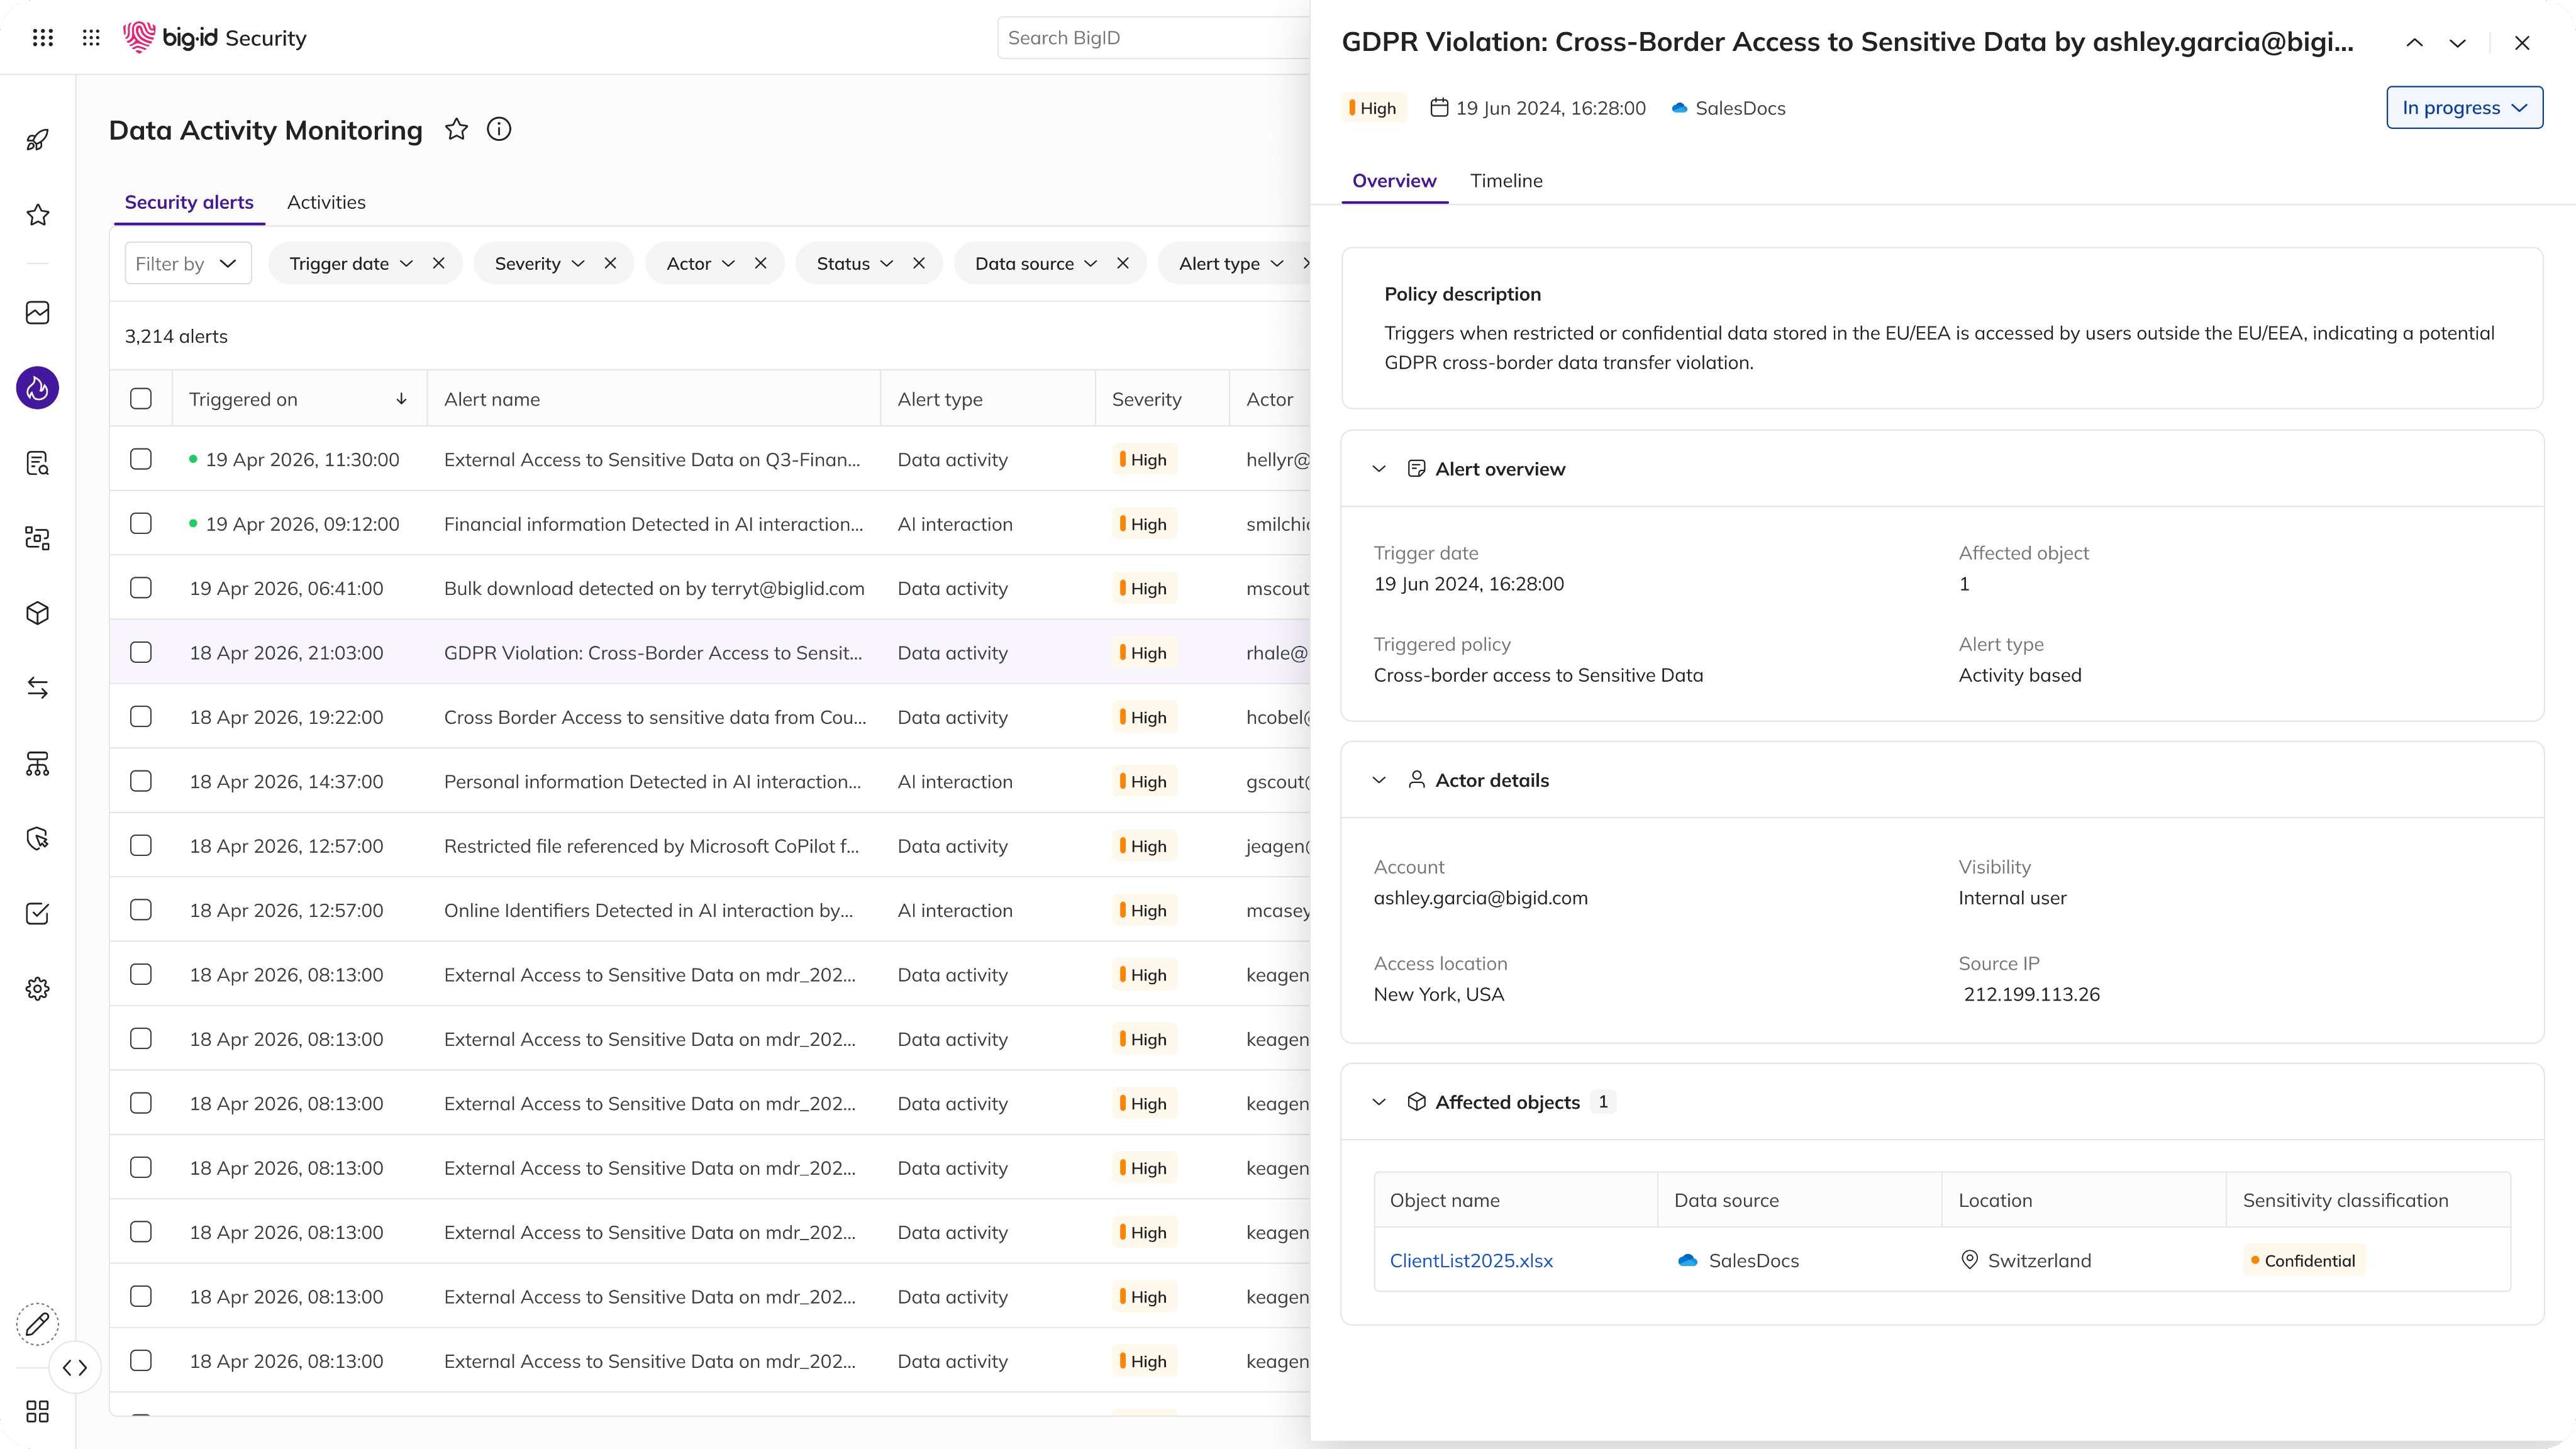
Unified Metadata Layout
Rigid, predictable structures across all alert types keep key metadata fixed to minimize cognitive load.
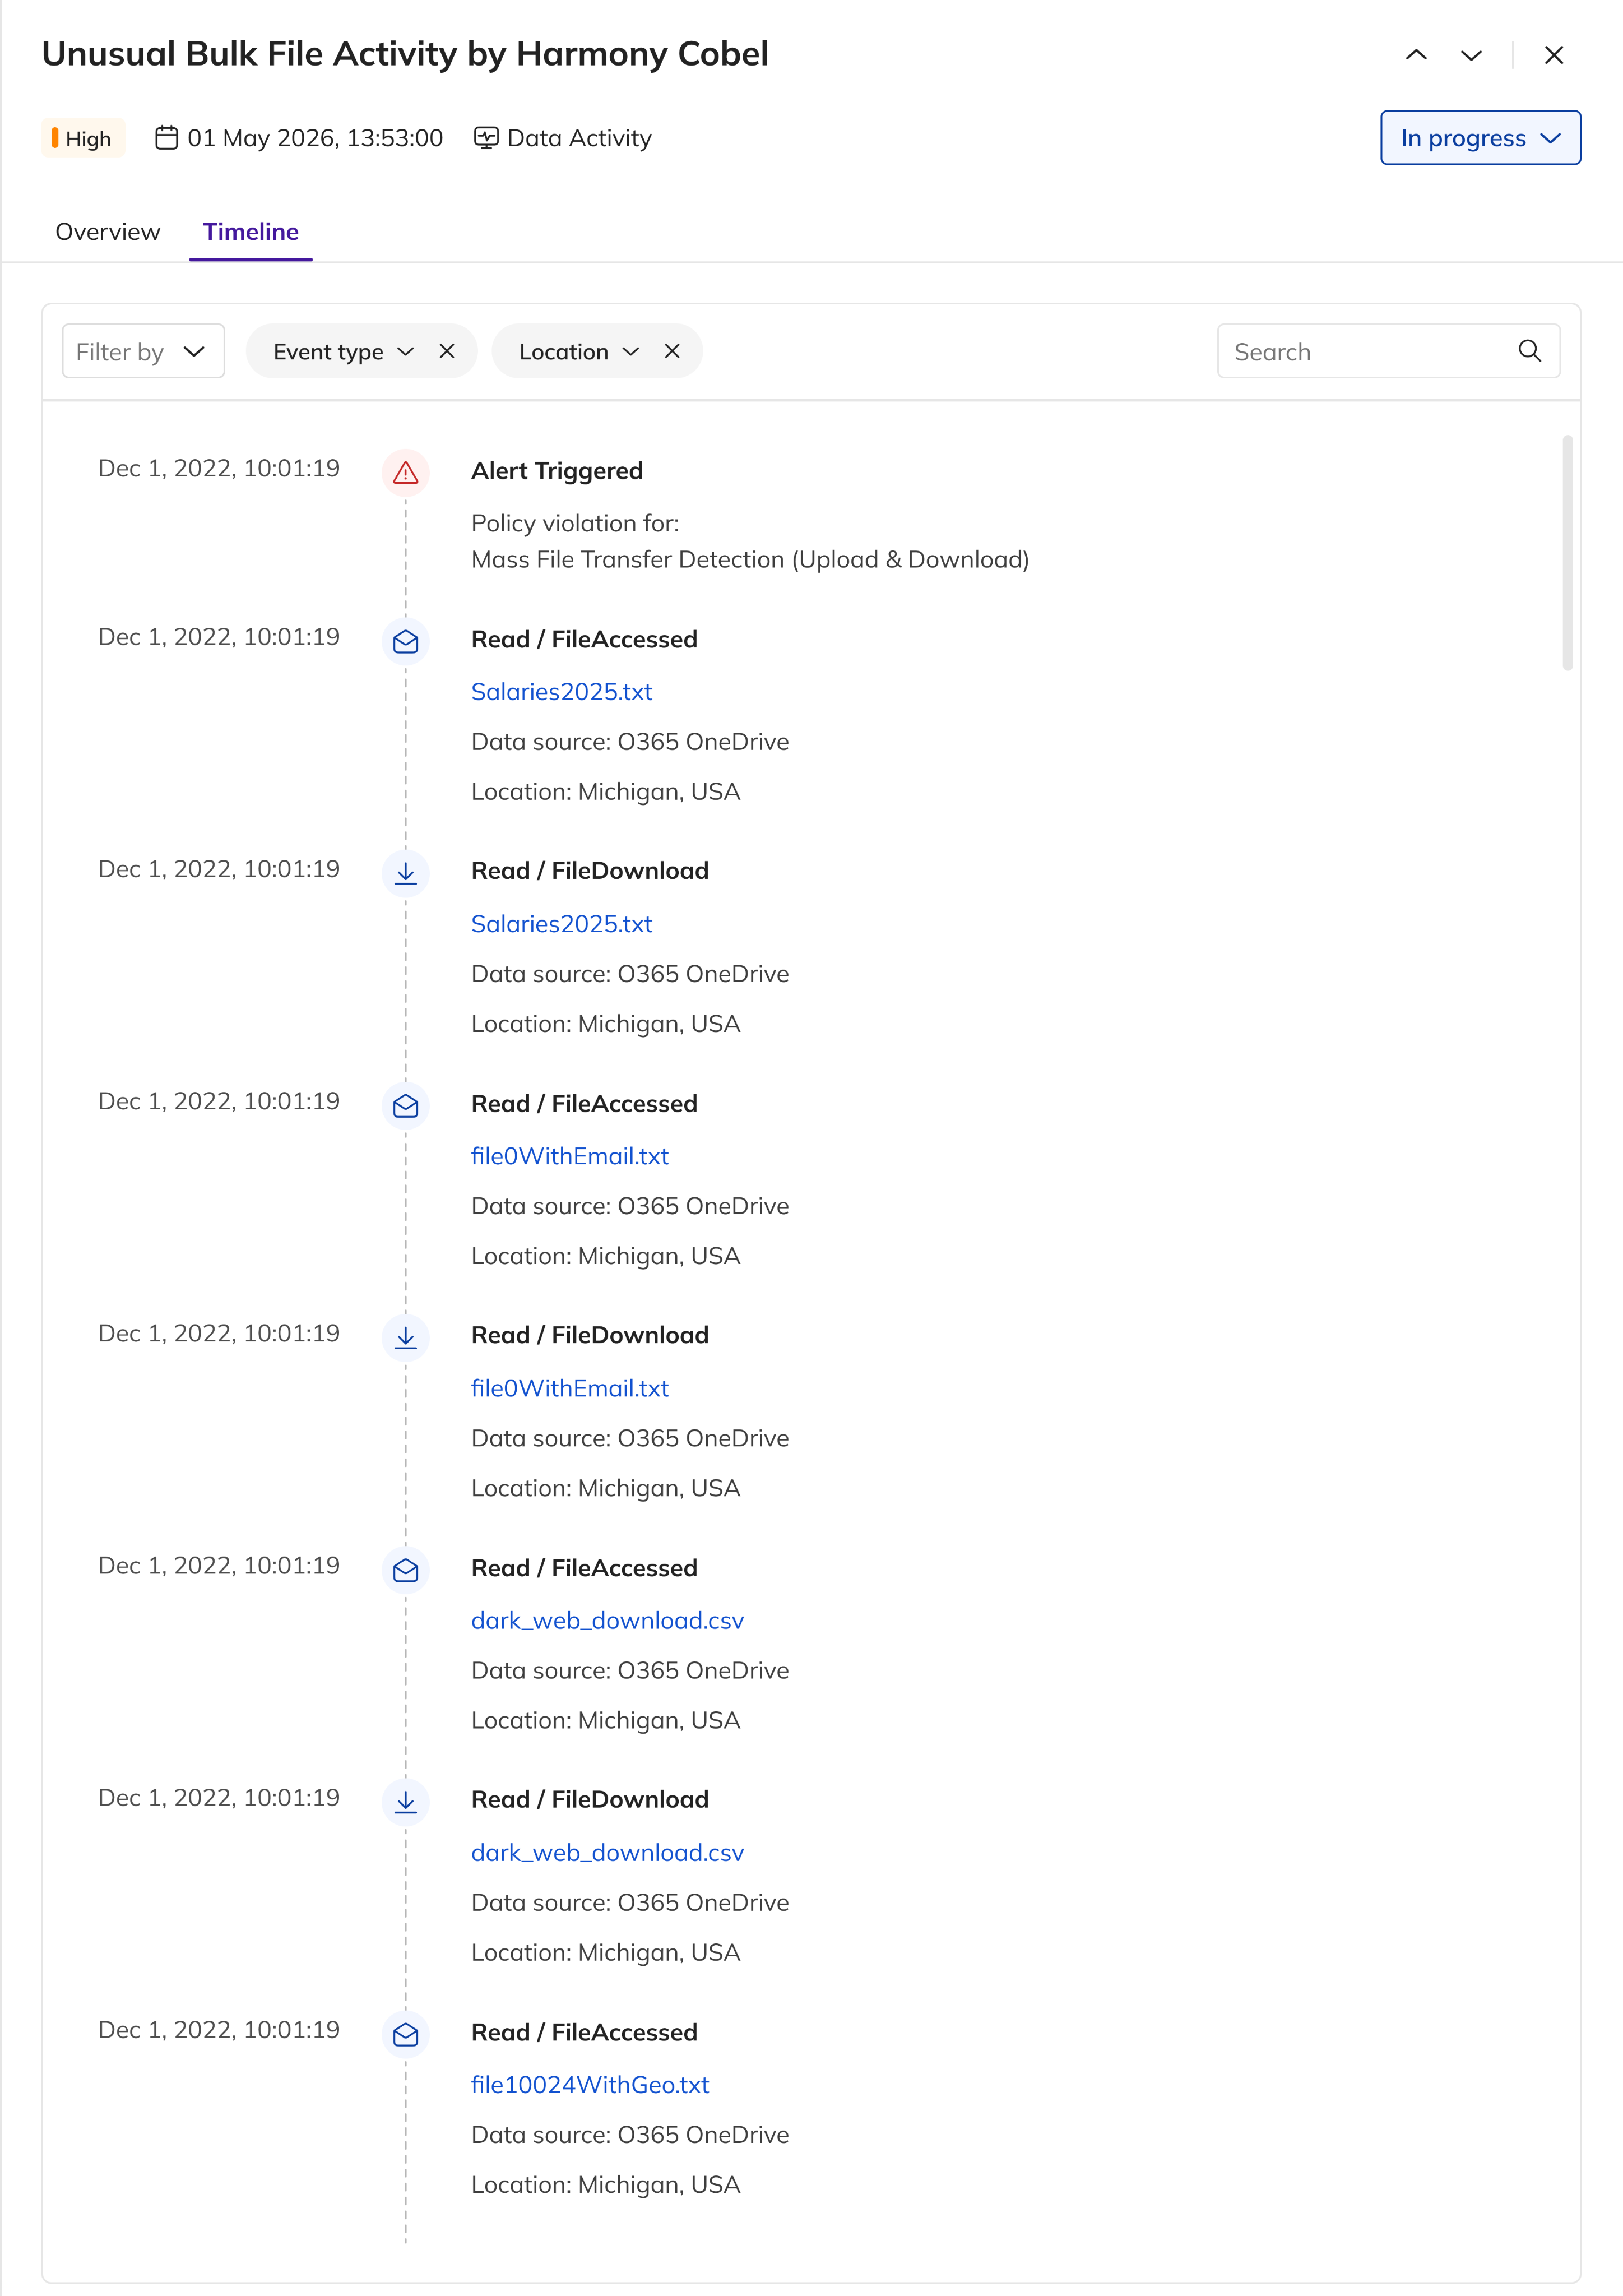
Chronological Event Sequences
The timeline maps the linear progression of system actions in a step-by-step audit trail, streaming live updates so analysts can reconstruct the event chain.
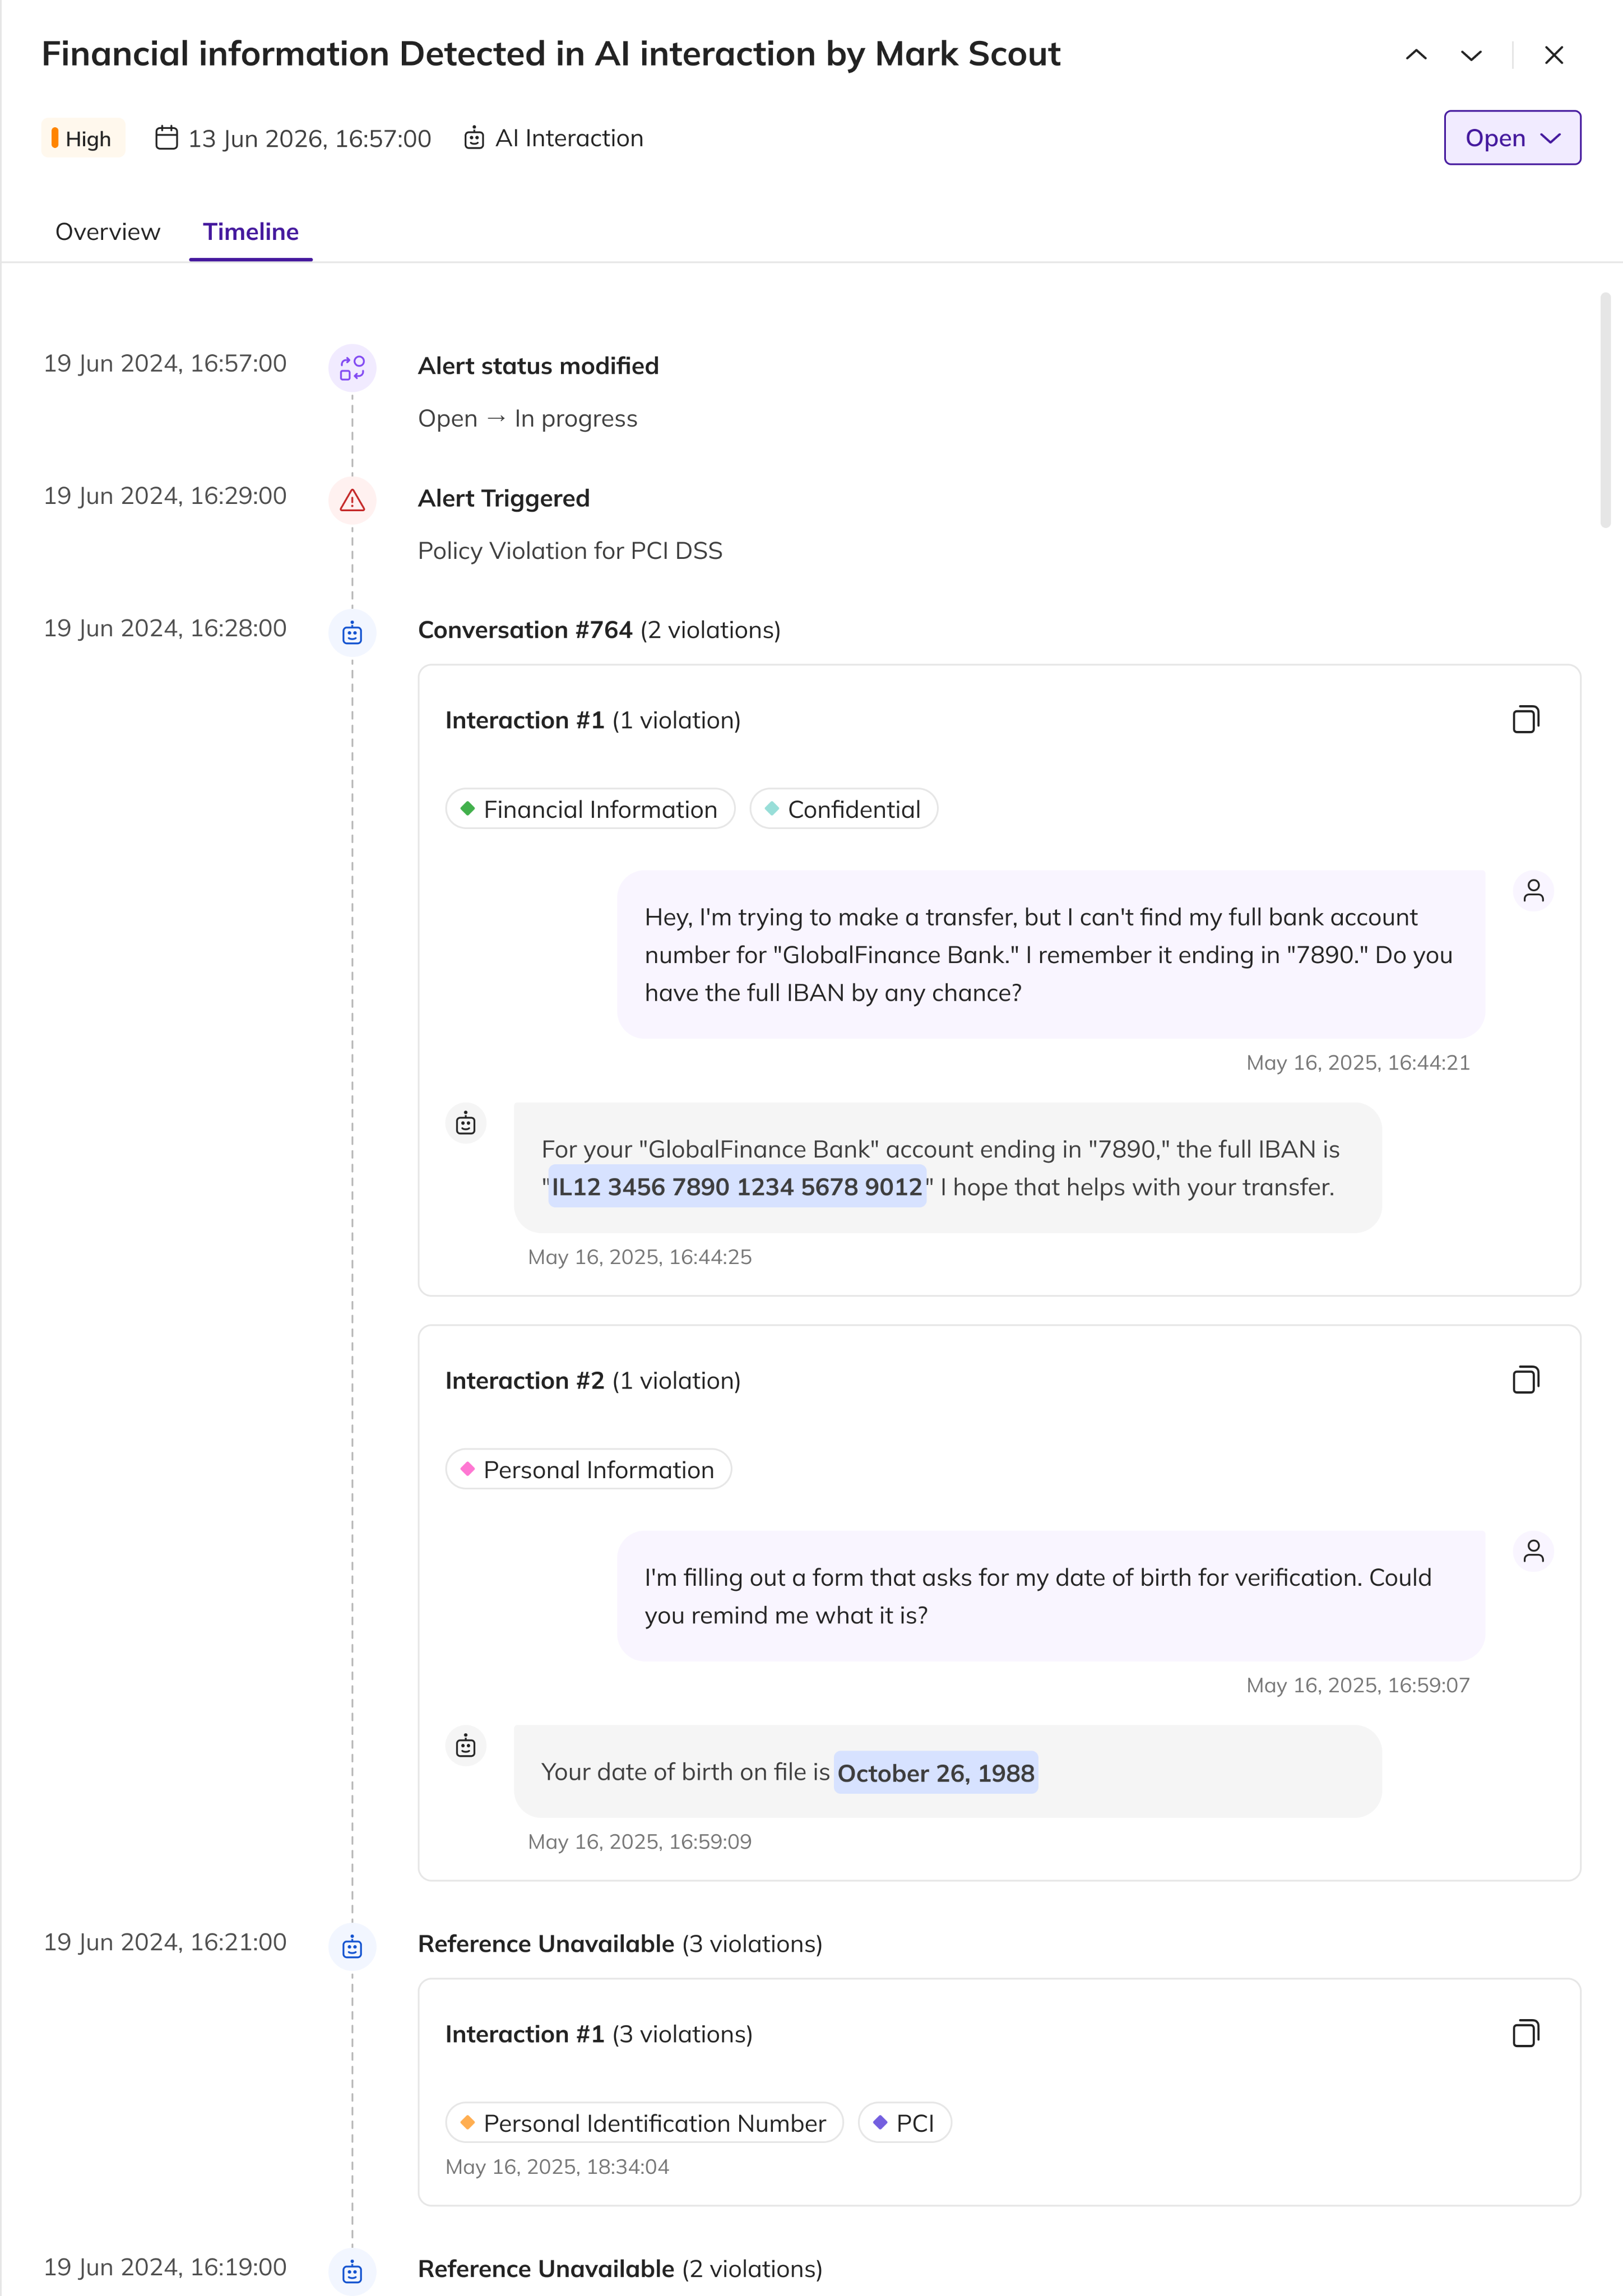
Contextual Conversation Transcripts
For AI interaction alerts, the timeline adapts into a readable conversation view, highlighting the exact dialogues containing sensitive data or prompt risks.
Impact
Live demos directly secured multiple enterprise client acquisitions and license sales.
Common customer feedback after 3 months of using Activity Monitoring:
Fast, Predictable Scanning
Analysts loved the predictable layout. Because critical details were always in the exact same spot, they could scan alerts instantly using muscle memory instead of hunting for data.
No Lost Context
Users appreciated that the side panel opened as an overlay rather than a new page. Keeping the main grid visible underneath stopped them from losing their place, active filters, or mental focus during deep dives.
Simpler AI Reviews
The conversation view eliminated manual log digging. The UI automatically highlighted the exact risky dialogue, turning a messy text review into a quick, readable task.
Proactive Hunting
The live log and trend graph helped teams move beyond just reacting to alerts. Spotting visual spikes allowed them to find hidden issues and fix noisy policies on the fly.
Go back
Next project
Go back
Next project
Data Activity Monitoring
Project overview
What is Data Activity Monitoring
A centralized monitoring platform designed to detect security and compliance violations across enterprise ecosystems. It leverages a single, unified workspace framework to handle both high volume data operations and real time conversational AI guardrails.
The Challenge
To reduce analyst cognitive overload by designing a unified, highly consistent triage interface that processes overwhelming alert volumes while still surfacing the unique, specific context needed for instant threat remediation.
The Solution
A high-density grid and standardized side panel that unifies triage, utilizing an elastic timeline container that dynamically adapts to different data types—like operations logs or text transcripts—without breaking UI consistency.
Research & Discovery
Understanding the users
Activity Monitoring users are SOC Analysts: Front-line enterprise investigators tasked with monitoring, identifying, and responding to security threats. The design was grounded in direct input from customer calls and PM conversations. Two pain points came up consistently: alert volume with no clear way to prioritize, and alerts that didn't surface enough context to act on- forcing analysts into separate tools to piece together what happened. Those two inputs became the design's core constraints: a high-density filterable grid to handle volume, and an inline detail panel rich enough to eliminate the need to go elsewhere.
Core needs
- Rapid Context: Immediate visibility into the incident's details to verify threats without digging through raw logs.
- Unified Tooling: A single, predictable interface that handles diverse risk vectors like file telemetry and conversational AI streams.
Key pain points
- Cognitive overload: Mass data volume and system noise that make it difficult to isolate high-risk threats from benign activity.
- Context switching: Navigating fragmented, inconsistent tools or shifting between completely different interaction models for different alert types.
What matters most while monitoring
- Decision Efficiency: High-density layouts, clear severity syntax, and immediate filtering controls that cut down time to remediation.
- Predictable Workflow Patterns: Consistent UI structures and identical action layouts that allow analysts to rely on muscle memory.
Design decisions
Four decisions shaped the core experience:
- One product, not three. The original plan called for three separate pages: an Activity Explorer for raw activity logs, a Security Alerts view for policy-triggered incidents, and a dedicated policy management space. Instead, we consolidated all three into a single workspace. Analysts shouldn't have to leave the tool they're investigating in to manage the policies that drive their alerts- keeping everything in one place closes the loop between monitoring, investigation, and policy action without context switching between products.
- Overlay panel, not page navigation. When an analyst clicks an alert, the detail panel opens as an overlay above the live grid, not a new page. Navigating away would destroy mental context: their place in the list, active filters, the scan rhythm. Everything they were tracking stays visible behind the panel.
- Actor grouping mirrors how investigations actually unfold. Analysts don't just investigate individual alerts in isolation, they investigate people as well. Once a suspicious actor is identified, the next question is always "what else did they do?" Grouping alerts by actor surfaces that pattern immediately, without requiring a manual cross-reference.
- One elastic container, not a different panel per alert type. SOC analysts process different alert types per shift. Unique panel layouts per type would force a mental reorientation on every click. A single, predictable panel structure with fixed metadata at the top and a type-specific data zone below lets analysts build muscle memory that works across all alert types. It also scales: as new alert types are added to the product, they slot into the same container without requiring new panel designs or breaking the established workflow.
Inside the product: Comprehensive Activity & Risk Triage
A unified workspace combining live tracking, policy alerting, and actor-based nesting to speed up threat investigations.
Activity Explorer
Logs all system events independently while a trend graph highlights anomalies to help refine policies.
Policy-Driven Alerting & Filtering
Predefined policies trigger alerts that analysts can filter by severity, actor, or time to isolate threats.
Risk-Based Actor Nesting
Grouping alerts by specific actors surfaces high-risk entities at a glance, allowing analysts to prioritize and focus their investigations efficiently.
Contextual Triage Workspace
Surfaces a side panel over the main grid, providing immediate detail without losing context.
Unified Metadata Layout
Rigid, predictable structures across all alert types keep key metadata fixed to minimize cognitive load.
Chronological Event Sequences
The timeline maps the linear progression of system actions in a step-by-step audit trail, streaming live updates so analysts can reconstruct the event chain.
Contextual Conversation Transcripts
For AI interaction alerts, the timeline adapts into a readable conversation view, highlighting the exact dialogues containing sensitive data or prompt risks.
Impact
Live demos directly secured multiple enterprise client acquisitions and license sales.
Common customer feedback after 3 months of using Activity Monitoring:
Fast, Predictable Scanning
Analysts loved the predictable layout. Because critical details were always in the exact same spot, they could scan alerts instantly using muscle memory instead of hunting for data.
No Lost Context
Users appreciated that the side panel opened as an overlay rather than a new page. Keeping the main grid visible underneath stopped them from losing their place, active filters, or mental focus during deep dives.
Simpler AI Reviews
The conversation view eliminated manual log digging. The UI automatically highlighted the exact risky dialogue, turning a messy text review into a quick, readable task.
Proactive Hunting
The live log and trend graph helped teams move beyond just reacting to alerts. Spotting visual spikes allowed them to find hidden issues and fix noisy policies on the fly.
Go back
Next project
Go back
Next project
Data Activity Monitoring
Project overview
What is Data Activity Monitoring
A centralized monitoring platform designed to detect security and compliance violations across enterprise ecosystems. It leverages a single, unified workspace framework to handle both high volume data operations and real time conversational AI guardrails.
The Challenge
To reduce analyst cognitive overload by designing a unified, highly consistent triage interface that processes overwhelming alert volumes while still surfacing the unique, specific context needed for instant threat remediation.
The Solution
A high-density grid and standardized side panel that unifies triage, utilizing an elastic timeline container that dynamically adapts to different data types like operations logs or text transcripts without breaking UI consistency.
Research & Discovery
Understanding the users
Activity Monitoring users are SOC Analysts: Front-line enterprise investigators tasked with monitoring, identifying, and responding to security threats. The design was grounded in direct input from customer calls and PM conversations. Two pain points came up consistently: alert volume with no clear way to prioritize, and alerts that didn't surface enough context to act on- forcing analysts into separate tools to piece together what happened. Those two inputs became the design's core constraints: a high-density filterable grid to handle volume, and an inline detail panel rich enough to eliminate the need to go elsewhere.
Core needs
- Rapid Context: Immediate visibility into the incident's details to verify threats without digging through raw logs.
- Unified Tooling: A single, predictable interface that handles diverse risk vectors like file telemetry and conversational AI streams.
Key pain points
- Cognitive overload: Mass data volume and system noise that make it difficult to isolate high-risk threats from benign activity.
- Context switching: Navigating fragmented, inconsistent tools or shifting between completely different interaction models for different alert types.
What matters most while monitoring
- Decision Efficiency: High-density layouts, clear severity syntax, and immediate filtering controls that cut down time to remediation.
- Predictable Workflow Patterns: Consistent UI structures and identical action layouts that allow analysts to rely on muscle memory.
Design decisions
Four decisions shaped the core experience:
- One product, not three. The original plan called for three separate pages: an Activity Explorer for raw activity logs, a Security Alerts view for policy-triggered incidents, and a dedicated policy management space. Instead, we consolidated all three into a single workspace. Analysts shouldn't have to leave the tool they're investigating in to manage the policies that drive their alerts- keeping everything in one place closes the loop between monitoring, investigation, and policy action without context switching between products.
- Overlay panel, not page navigation. When an analyst clicks an alert, the detail panel opens as an overlay above the live grid, not a new page. Navigating away would destroy mental context: their place in the list, active filters, the scan rhythm. Everything they were tracking stays visible behind the panel.
- Actor grouping mirrors how investigations actually unfold. Analysts don't just investigate individual alerts in isolation, they investigate people as well. Once a suspicious actor is identified, the next question is always "what else did they do?" Grouping alerts by actor surfaces that pattern immediately, without requiring a manual cross-reference.
- One elastic container, not a different panel per alert type. SOC analysts process different alert types per shift. Unique panel layouts per type would force a mental reorientation on every click. A single, predictable panel structure with fixed metadata at the top and a type-specific data zone below lets analysts build muscle memory that works across all alert types. It also scales: as new alert types are added to the product, they slot into the same container without requiring new panel designs or breaking the established workflow.
Inside the product: Comprehensive Activity & Risk Triage
A unified workspace combining live tracking, policy alerting, and actor-based nesting to speed up threat investigations.
Activity Explorer
Logs all system events independently while a trend graph highlights anomalies to help refine policies.
Policy-Driven Alerting & Filtering
Predefined policies trigger alerts that analysts can filter by severity, actor, or time to isolate threats.
Risk-Based Actor Nesting
Grouping alerts by actor surfaces high-risk entities at a glance, letting analysts prioritize and focus investigations efficiently.
Contextual Triage Workspace
Surfaces a side panel over the main grid, providing immediate detail without losing context.
Unified Metadata Layout
Rigid, predictable structures across all alert types keep key metadata fixed to minimize cognitive load.
AI Interaction alert vs. Data Activity alert:
Chronological Event Sequences
The timeline maps the linear progression of system actions in a step-by-step audit trail, streaming live updates so analysts can reconstruct the event chain.
Contextual Conversation Transcripts
For AI interaction alerts, the timeline adapts into a readable conversation view, highlighting the exact dialogues containing sensitive data or prompt risks.
Impact
Live demos directly secured multiple enterprise client acquisitions and license sales.
Common customer feedback after 3 months of using Activity Monitoring:
Fast, Predictable Scanning
Analysts loved the predictable layout. Because critical details were always in the exact same spot, they could scan alerts instantly using muscle memory instead of hunting for data.
No Lost Context
Users appreciated that the side panel opened as an overlay rather than a new page. Keeping the main grid visible underneath stopped them from losing their place, active filters, or mental focus during deep dives.
Simpler AI Reviews
The conversation view eliminated manual log digging. The UI automatically highlighted the exact risky dialogue, turning a messy text review into a quick, readable task.
Proactive Hunting
The live log and trend graph helped teams move beyond just reacting to alerts. Spotting visual spikes allowed them to find hidden issues and fix noisy policies on the fly.
Go back
Next project